

数据库 一年的不同时间段
Comparing a single metric over different time periods is a quite common procedure in data analytics. You can evaluate your company’s performance by comparing this year’s revenue with the previous year’s. You can understand which are the low and high sales months in your market, and furthermore, you can predict customer behavior and figure out seasonal patterns.
在不同时间段内比较单个指标是数据分析中非常普遍的过程。 您可以通过将今年的收入与上一年的收入进行比较来评估公司的业绩。 您可以了解市场上哪些是低销售月和高销售月,而且可以预测客户行为并弄清楚季节性模式。
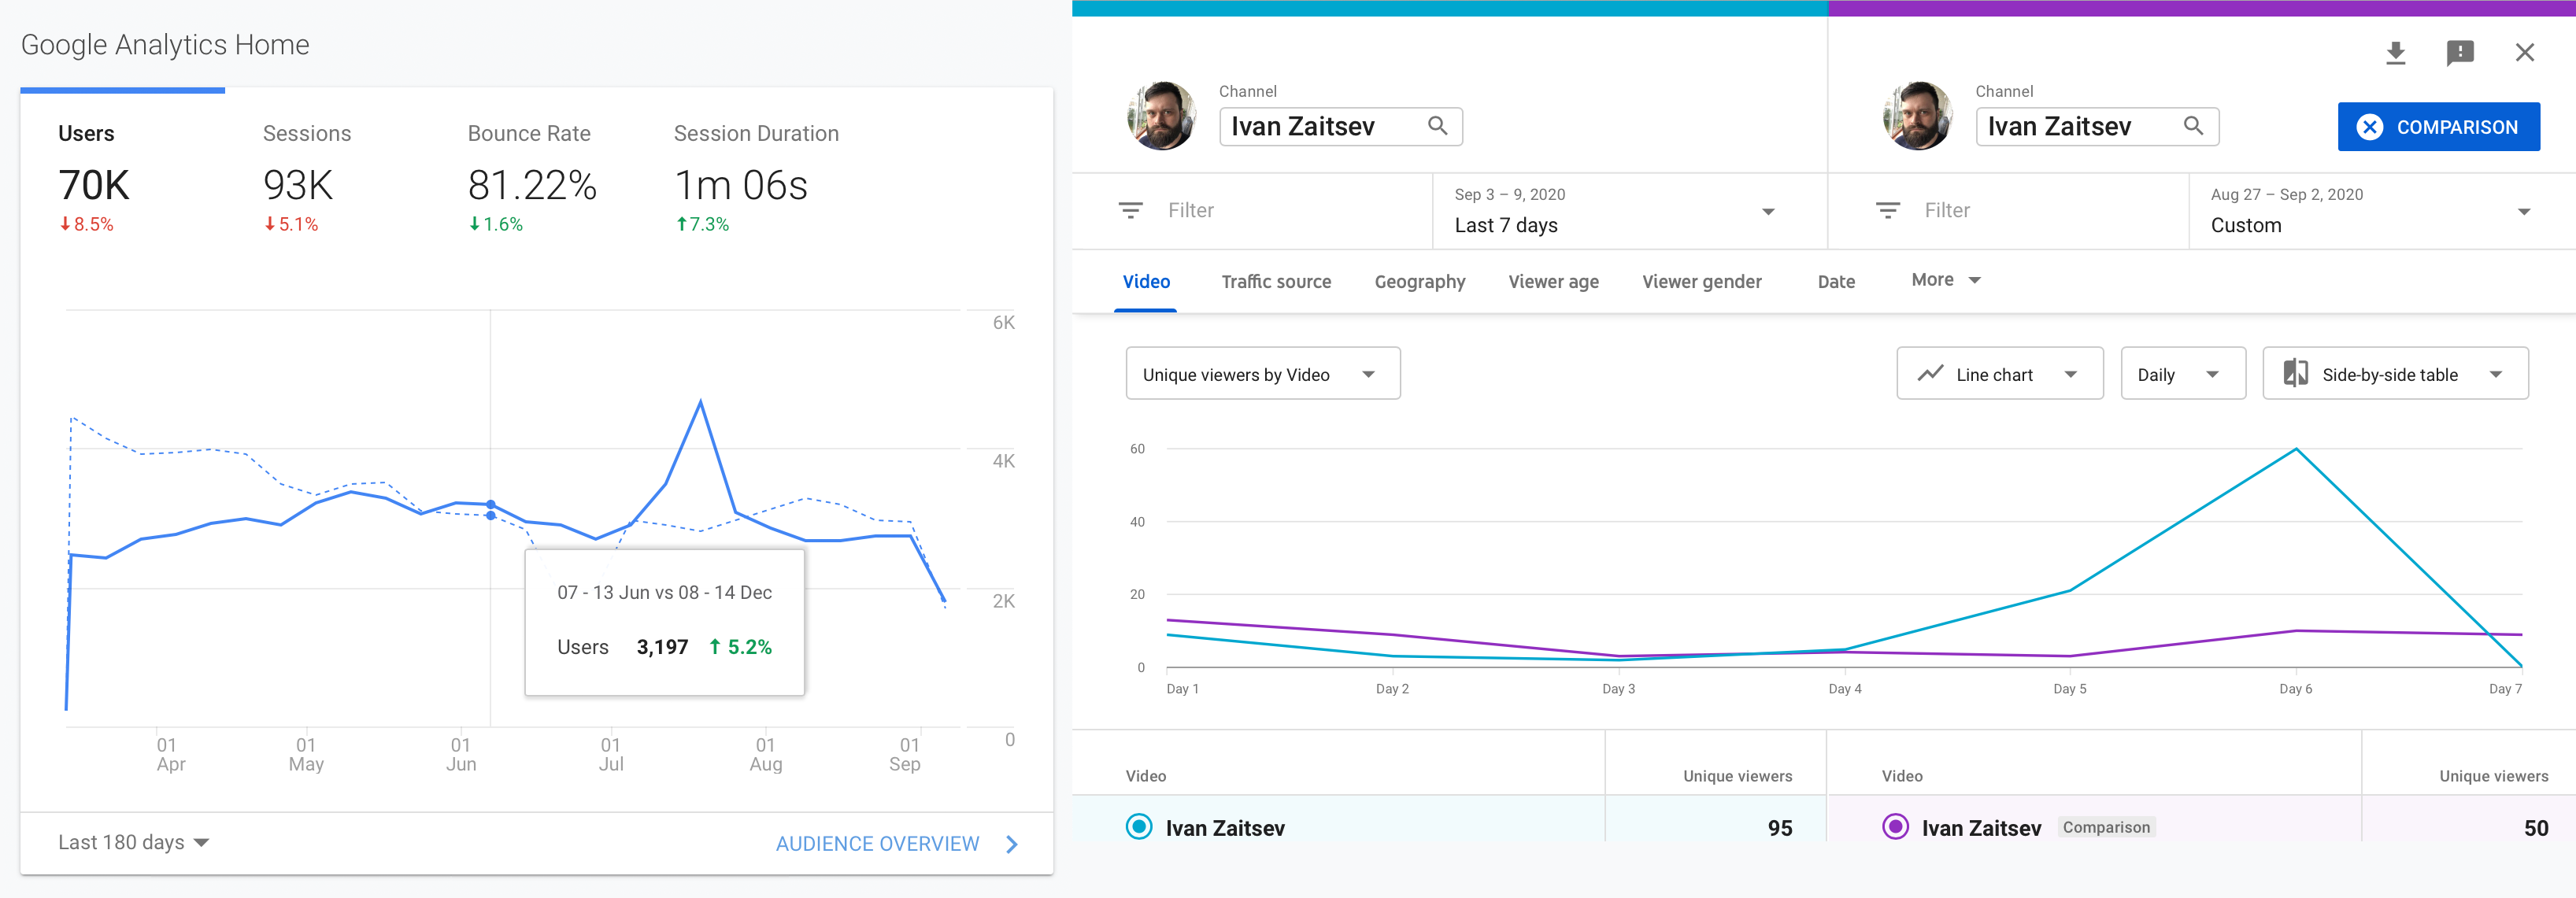
Analytical systems like Google Analytics, Youtube Studio, and others provide tools for comparing a single metric over different periods of time.
诸如Google Analytics(分析),Youtube Studio之类的分析系统和其他系统提供了用于比较不同时间段内单个指标的工具。
Let’s see how you can implement such analytical visualization with Cube.js.
让我们看看如何使用Cube.js实现这种分析可视化。
Here we will explore a sample e-commerce dataset and compare the numbers of orders in the three most recent years. To do this, we need to run a Cube.js server and a simple dashboard application.
在这里,我们将探索一个示例电子商务数据集,并比较最近三年的订单数量。 为此,我们需要运行一个Cube.js服务器和一个简单的仪表板应用程序。
If you’re not yet familiar with Cube.js, please follow our guide to setting up the database, starting a Cube.js server, and getting information about data schemes and analytical cubes.
如果您还不熟悉Cube.js,请遵循我们的 指南 来设置数据库,启动Cube.js服务器以及获取有关数据方案和分析多维数据集的信息。
Now, let’s create the Orders cube inside the schema folder with the following code:
现在,让我们使用以下代码在schema文件夹内创建Orders多维数据集:
cube(`Orders`, {
  sql: `SELECT * FROM public.orders`,measures: {
    count: {
      type: `count`,
    },
  },dimensions: {
    id: {
      sql: `id`,
      type: `number`,
      primaryKey: true,
    },
    createdAt: {
      sql: `created_at`,
      type: `time`,
    },
  },
});
Here the count measure is used to calculate the number of orders. The createdAt field is used to retrieve an order's timestamp.
此处, count度量用于计算订单数量。 createdAt字段用于检索订单的时间戳。
In the next sections, we will implement the example with React, but you can use the same approach with Vue, Angular, and vanilla JS.
在下一部分中,我们将使用React实现示例,但是您可以对Vue,Angular和Vanilla JS使用相同的方法。
单个图表的多个查询 (Multiple queries for a single chart)
Here’s how we retrieve the data for each year and parse result sets into the format that is accepted by our charting library:
这是我们检索每年数据并将结果集解析为图表库接受的格式的方式:
import React, { useState, useEffect } from 'react';
import { useCubeQuery } from '@cubejs-client/react';
import * as moment from 'moment';
import Line from './Line';
export default () => {
const [data, setData] = useState([]);
const { resultSet: result22 } = useCubeQuery({
measures: ['Orders.count'],
timeDimensions: [
{
dimension: 'Orders.createdAt',
dateRange: ['2022-01-01', '2022-12-31'],
granularity: 'month',
},
],
});
const { resultSet: result21 } = useCubeQuery({
measures: ['Orders.count'],
timeDimensions: [
{
dimension: 'Orders.createdAt',
dateRange: ['2021-01-01', '2021-12-31'],
granularity: 'month',
},
],
});
const { resultSet: result20 } = useCubeQuery({
measures: ['Orders.count'],
timeDimensions: [
{
dimension: 'Orders.createdAt',
dateRange: ['2020-01-01', '2020-12-31'],
granularity: 'month',
},
],
});
useEffect(() => {
const parseResultSet = (resultSet) => {
return {
name: moment(
resultSet.tablePivot()[0]['Orders.createdAt.month']
).format('YYYY'),
data: resultSet
.tablePivot()
.map((item) => parseInt(item['Orders.count'])),
};
};
const temp = [
result22 ? parseResultSet(result22) : [],
result21 ? parseResultSet(result21) : [],
result20 ? parseResultSet(result20) : [],
];
setData(temp);
}, [result22, result21, result20]);
return <Line data={data} title={'multiple queries'} />;
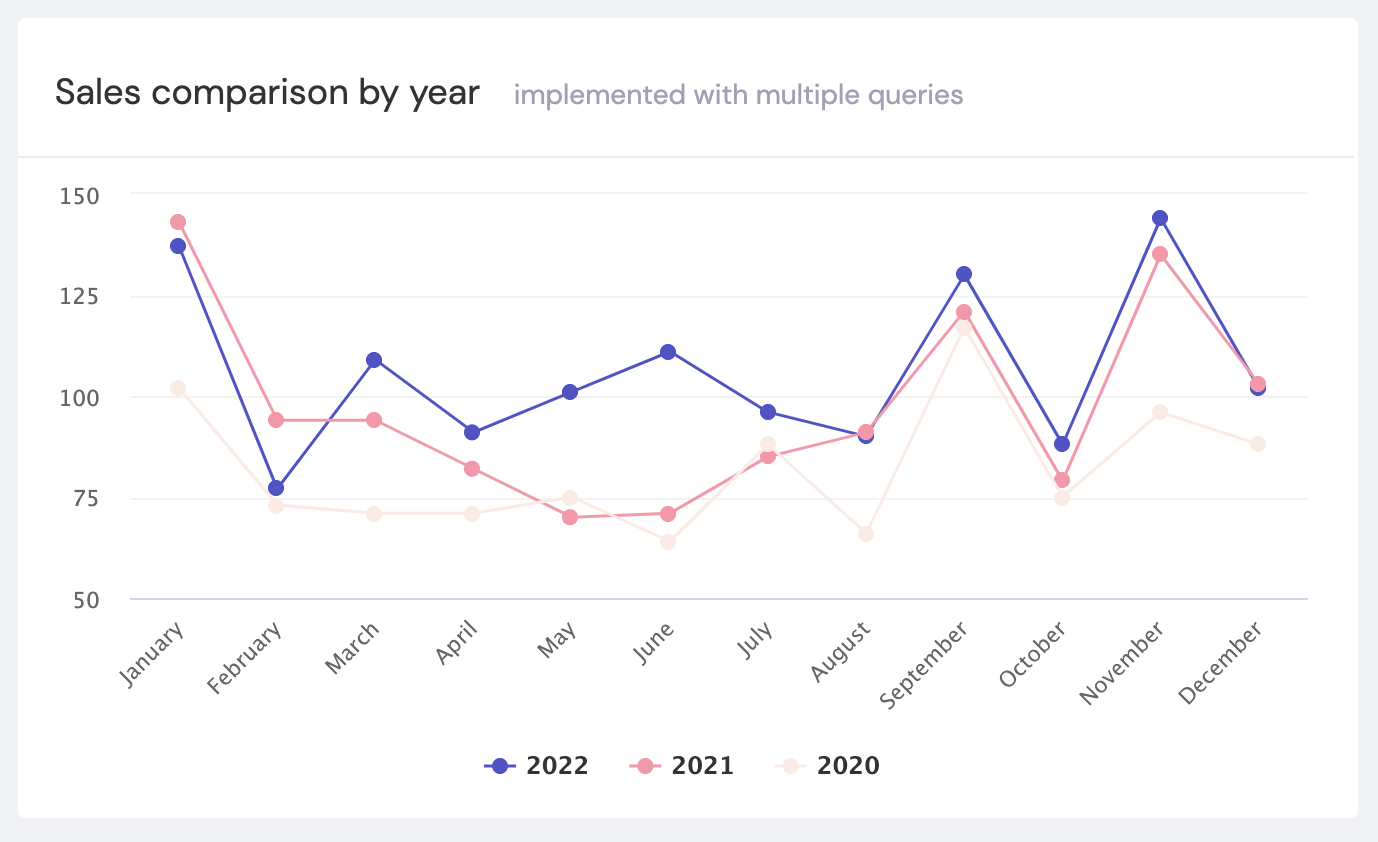
};Once the data is prepared, we send it to the <Line /> rendering component and, behold, we create an informative chart:
数据准备好后,我们将其发送到<Line />渲染组件,然后,我们创建了一个信息图表:
The procedure is quite simple, isn’t it? However, as you can see, the code is a little bit messy and repetitive. More importantly, it’s not easy to adapt the code to a different amount of years or even to adjust it dynamically in response to users’ actions or application states.
程序很简单,不是吗? 但是,如您所见,代码有点混乱且重复。 更重要的是,将代码适应不同的年份,甚至响应用户的操作或应用程序状态进行动态调整也不容易。
How do we solve this problem? Let’s try another approach.
我们如何解决这个问题? 让我们尝试另一种方法。
单个查询单个图表 (A single query for a single chart)
With the 0.20.0 release of Cube.js, it’s possible to retrieve data for different time periods using a single query.
使用0.20.0版本的Cube.js,可以使用单个查询来检索不同时间段的数据。
The compareDateRange property accepts an array of two or more different time periods and returns data for all of them in one request.
compareDateRange属性接受两个或多个不同时间段的数组,并在一个请求中返回所有时间段的数据。
We can rewrite our previous code in a simpler way:
我们可以以更简单的方式重写之前的代码:
import React, { useState, useEffect } from 'react';
import { useCubeQuery } from '@cubejs-client/react';
import Line from './Line';
export default () => {
  const [data, setData] = useState([]);
  const { resultSet: result } = useCubeQuery({
    measures: ['Orders.count'],
    timeDimensions: [
      {
        dimension: 'Orders.createdAt',
        compareDateRange: [
          ['2022-01-01', '2022-12-31'],
          ['2021-01-01', '2021-12-31'],
          ['2020-01-01', '2020-12-31'],
        ],
        granularity: 'month',
      },
    ],
  });
  useEffect(() => {
    if (result) {
      const temp = result.series().map((data) => {
        return {
          name: data.key.substring(0, 4),
          data: data.series.map((item) => item.value),
        };
      });
      setData(temp);
    }
  }, [result]);
  return <Line data={data} title={'the single query'} />;
};
You can see that this code is much shorter. Furthermore, now we’re able to set the time periods via compareDateRange dynamically while keeping our code clean.
您可以看到这段代码要短得多。 此外,现在我们可以通过compareDateRange动态设置时间段,同时保持代码的整洁。
Please note that we didn’t make any changes in the <Line /> rendering component, so the chart will look essentially the same.
请注意,我们没有在<Line />渲染组件中进行任何更改,因此该图表看起来基本相同。
Here you can see the live demo and the full source code for this example.
I hope that this will help you create useful data visualizations using substantially less code.
我希望这将帮助您使用更少的代码来创建有用的数据可视化。
Also, don’t forget to sign up for our monthly newsletter to get more information about Cube.js updates and releases.
另外,不要忘记注册我们的每月时事通讯,以获取有关Cube.js更新和发行的更多信息。
Originally published at https://cube.dev on September 10, 2020.
最初于 2020年9月10日 发布在 https://cube.dev 。
翻译自: https://blog.statsbot.co/comparing-data-over-different-time-periods-f77ba4acd692
数据库 一年的不同时间段


 已为社区贡献1条内容

所有评论(0)