
python的数据处理
python的数据相关操作
·
一,数据缺失值处理
(1)缺失值处理
dropna :删除空值
fillna:使用指定值或插值的方法
isnull :判断是否为空值,空返回True
notnull:isnull的否定
import matplotlib.pyplot as plt
import numpy as np
import  pandas as pd
from scipy import stats #导入假设检验分析模块儿
np.random.seed(1)#设置随机数种子
df=pd.DataFrame(np.random.randn(6,4),columns=list('ABCD'))
print(df)
#插入一些缺失值
print('---------------------------------------------------')
df.iloc[2:4,2:4]=np.nan
df.iloc[1,0:2]=np.nan
print(df)
t=df.isnull()
print(t)
#对指定缺失值进行处理,C列缺失值用0.5进行补偿
df.fillna({'C':0.5},inplace=True)
print(df)
#使用前向和后向
print('---------------------缺失值-------------------------------------')
#必须注意,fillna是返回新的,本身原来的数据集不变
df.fillna(method = 'backfill')
print(df)
#所以必须这样子才可以填充值
r=df.fillna(method = 'backfill')
print(r)
二,数据标准化
使用LabelEncoder
三,数据的假设检验
K-S检验
#对数据进行正态性检验
#使用K——S检验法
p2,p3=stats.kstest(x_1,'norm')
print(f'{p2},置信度为{p3}')
np.random.seed(19)
x_1=stats.norm.rvs(size=100) #正态分布生成随机数
plt.figure()#开启画布
plt.hist(x_1,bins=20,color='blue')
plt.xlabel('x')
plt.ylabel('fequence')
plt.title('hist plot')
plt.show()
四,数据间的关系
链接: link
五,数据的可视化
import matplotlib.pyplot as plt
import seaborn as sns
import pandas as pd
#画个饼状图
#使用matplotlib库
labels=['szu','whu','thu','heb']#标记
size=[99,88,86,98]#每一个类的频数大小
color=['blue','yellow','red','green']
explode=(0,0.1,0.2,0)#0.1表示分离块儿
plt.pie(
size,explode=explode,
labels=labels,colors=color,
shadow=True,
autopct="%3.1f%%",#以某种数字格式展示
startangle=0#以x轴方向的转向开始角度
)
plt.title('univerties')
plt.axis('equal')
plt.show()
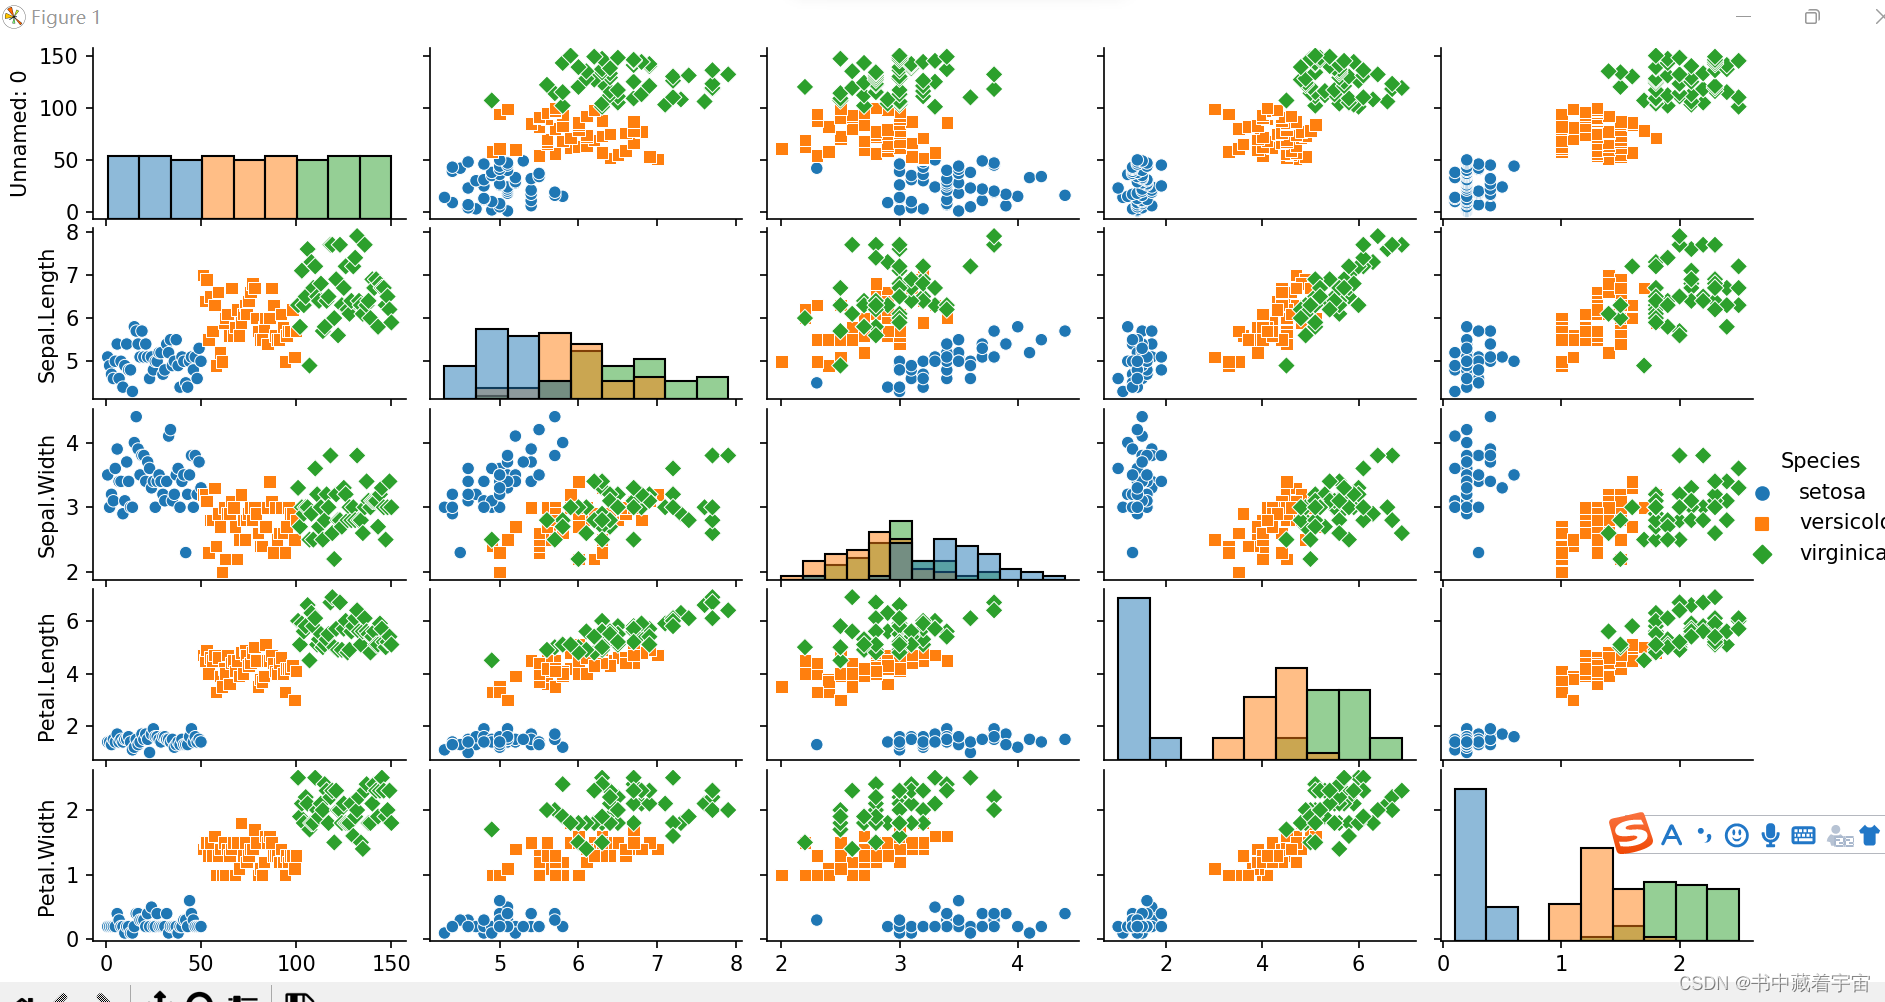
#data=sns.load_dataset("iris")#连接不了外网,数据导入不进来
data=pd.read_csv(r"D:\研究生学习\python学习\Iris数据集\iris.csv")
sns.pairplot(data,hue='Species',size=3,
diag_kind='hist',
markers=['o','s','D'])
plt.show()
六,PCA主成成分分析

腾讯云面向开发者汇聚海量精品云计算使用和开发经验,营造开放的云计算技术生态圈。
更多推荐


 0
0 0
0- 0


 已为社区贡献1条内容

所有评论(0)