绘制ROC曲线95%置信区间
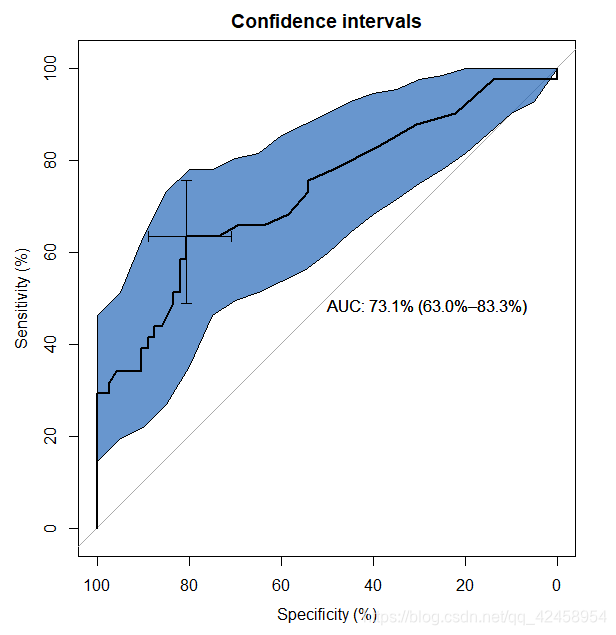
1.用plot绘制,主要函数为ci.se,对roc进行抽样library(pROC)data(aSAH)rocobj <- plot.roc(aSAH$outcome, aSAH$s100b,main="Confidence intervals", percent=TRUE,ci=TRUE, # compute AUC (of AU.
·
1.用plot绘制,主要函数为ci.se,对roc进行抽样
library(pROC)
data(aSAH)
rocobj <- plot.roc(aSAH$outcome, aSAH$s100b,

                   main="Confidence intervals", percent=TRUE,

                   ci=TRUE, # compute AUC (of AUC by default)

                   print.auc=TRUE) # print the AUC (will contain the CI)

ciobj <- ci.se(rocobj, # CI of sensitivity

               specificities=seq(0, 100, 5)) # over a select set of specificities

plot(ciobj, type="shape", col="#1c61b6AA") # plot as a blue shape
plot(ci(rocobj, of="thresholds", thresholds="best")) # add one threshold
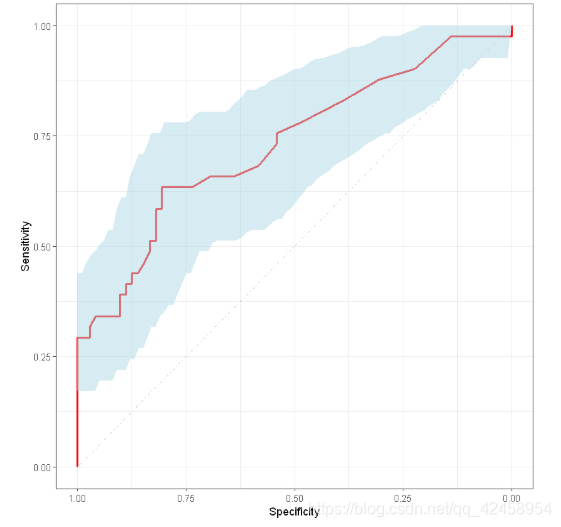
2.ggplot绘制
library(pROC)
library(ROCR)
rocobj <- roc(aSAH$outcome, aSAH$s100b,auc = TRUE,

                   ci=TRUE, # compute AUC (of AUC by default)

                   print.auc=TRUE) # print the AUC (will contain the CI)

ciobj <- ci.se(rocobj, # CI of sensitivity

               specificities=seq(0, 1, 0.01)) # over a select set of specificities

auc<-auc(rocobj)[1]
auc_low<-ci(rocobj,of="auc")[1]
auc_high<-ci(rocobj,of="auc")[3]
auc_full<-paste("AUC:",round(auc,digits = 3),"(",
                     round(auc_low,digits = 3),",",round(auc_high,digits = 3),")",sep = "")

data_ci<-ciobj[1:101,1:3]
data_ci<-as.data.frame(data_ci)
x=as.numeric(rownames(data_ci))
data_ci<-data.frame(x,data_ci)
library(ggplot2)
ggroc(rocobj,color="red",size=1)+theme_bw()+
  geom_segment(aes(x = 1, y = 0, xend = 0, yend = 1),
               colour='grey', linetype = 'dotdash') +
  geom_ribbon(data = data_ci,aes(x=x,ymin=X2.5.,ymax=X97.5.), fill = 'lightblue',alpha=0.5)+
  theme(plot.title = element_text(hjust = 0.5),
        legend.justification=c(1, 0), legend.position=c(.95, .05),
        #legend.title=title,
        legend.background = element_rect(fill=NULL, size=0.5,
                                         linetype="solid", colour ="black"))+
  labs(x="Specificity",y="Sensitivity")
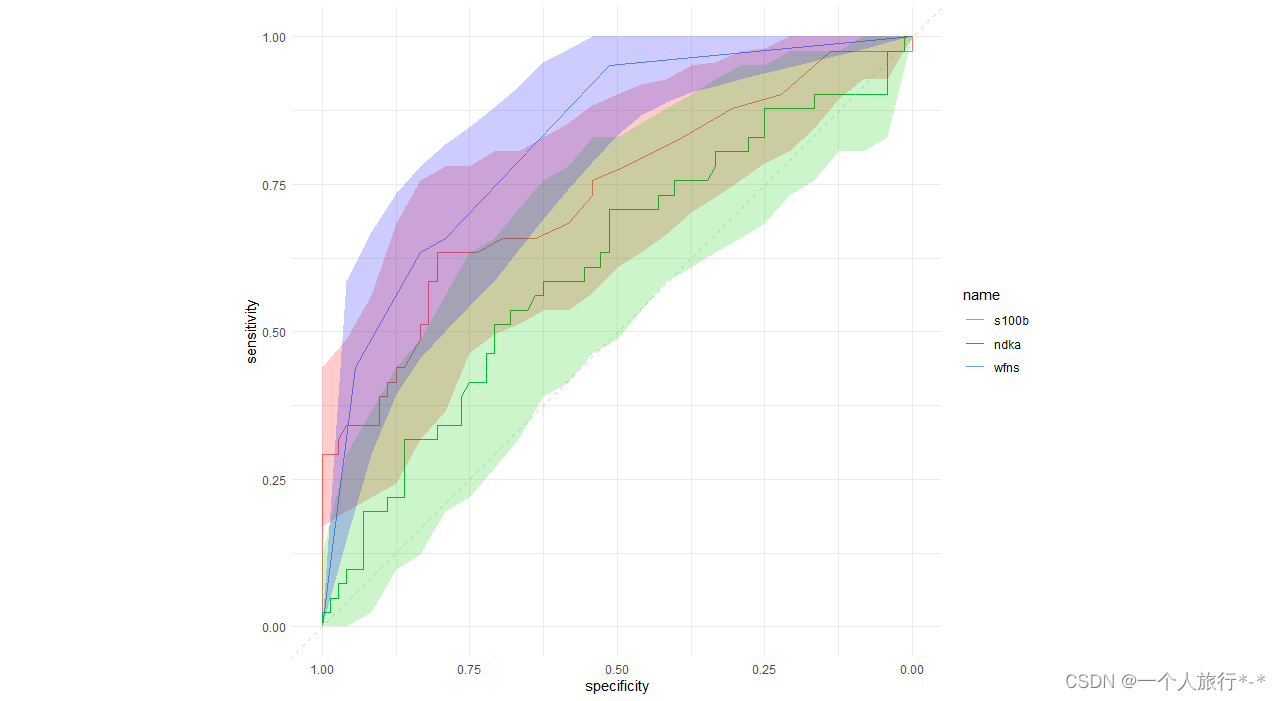
3.绘制多个ROC curve
library(pROC)
roc.list <- roc(outcome ~ s100b + ndka + wfns, data = aSAH)


ci.list <- lapply(roc.list, ci.se, specificities = seq(0, 1, l = 25))

dat.ci.list <- lapply(ci.list, function(ciobj)
  data.frame(x = as.numeric(rownames(ciobj)),
             lower = ciobj[, 1],
             upper = ciobj[, 3]))

p <- ggroc(roc.list) + theme_minimal() + geom_abline(slope=1, intercept = 1, linetype = "dashed", alpha=0.7, color = "grey") + coord_equal()

for(i in 1:3) {
  p <- p + geom_ribbon(
    data = dat.ci.list[[i]],
    aes(x = x, ymin = lower, ymax = upper),
    fill = i + 1,
    alpha = 0.2,
    inherit.aes = F)
}

p
如有绘图需求,请联系


腾讯云面向开发者汇聚海量精品云计算使用和开发经验,营造开放的云计算技术生态圈。
更多推荐


 14
14 0
0- 0


 已为社区贡献2条内容

所有评论(0)