import numpy as np
import pandas as pd
import seaborn as sns
import matplotlib.pyplot as plt
sns.set_style("whitegrid")
from scipy.stats import f_oneway
import warnings
warnings.filterwarnings('ignore')
df = pd.read_csv("smartphones.csv")
df.head()
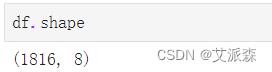
df.shape
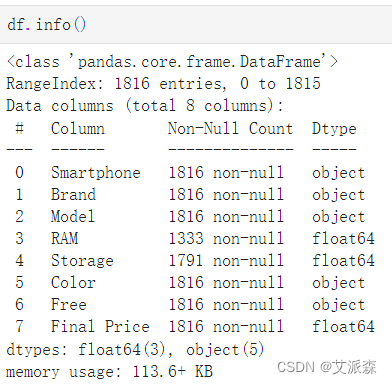
df.info()
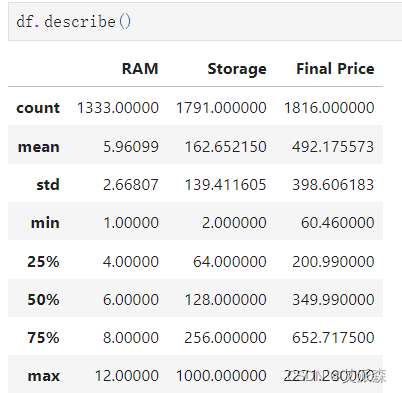
df.describe()
df.describe(include='O')
df.isnull().sum()
df.duplicated().sum()
# df.dropna(inplace=True)
# df.isnull().sum()
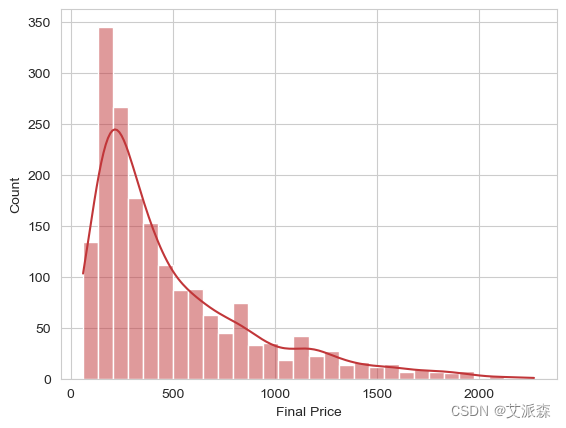
# 价格分布
sns.histplot(data=df,x='Final Price',kde=True)
plt.show()
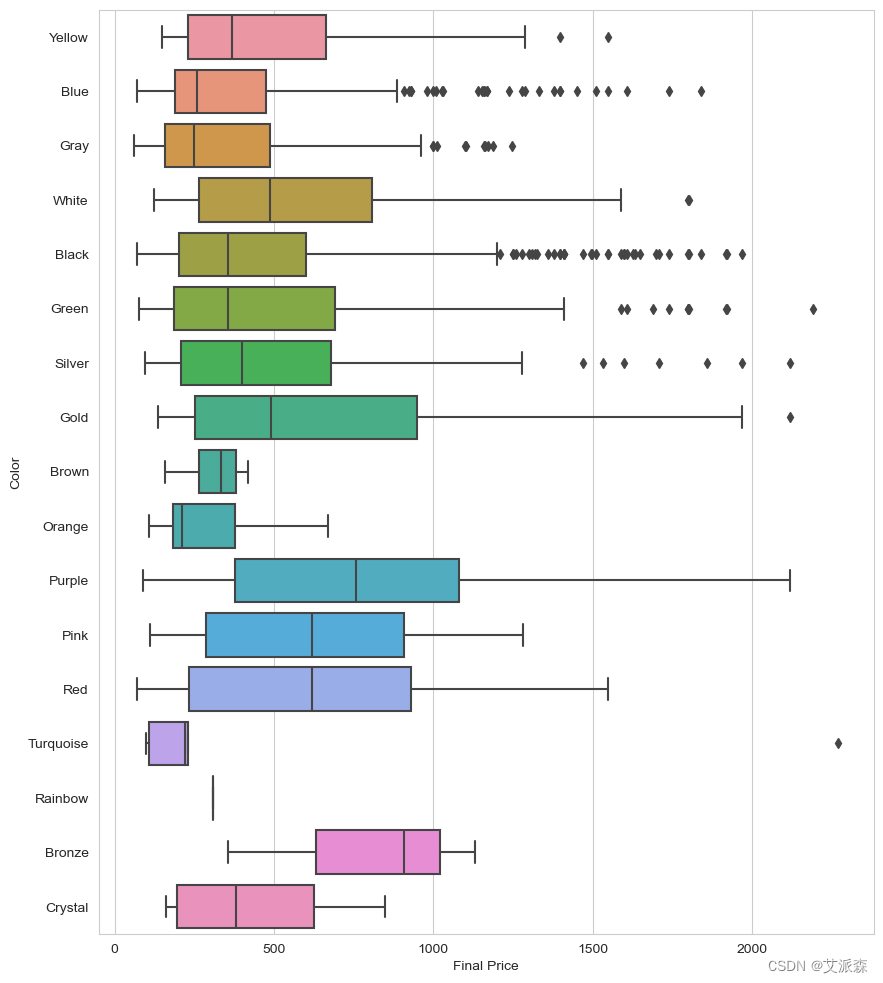
# 各品牌手机的价格箱线图
plt.figure(figsize=(12,14))
sns.boxplot(data=df,x='Final Price',y='Brand')
plt.show()
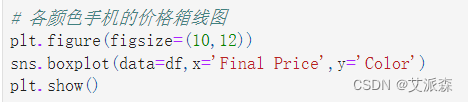
# 各颜色手机的价格箱线图
plt.figure(figsize=(10,12))
sns.boxplot(data=df,x='Final Price',y='Color')
plt.show()
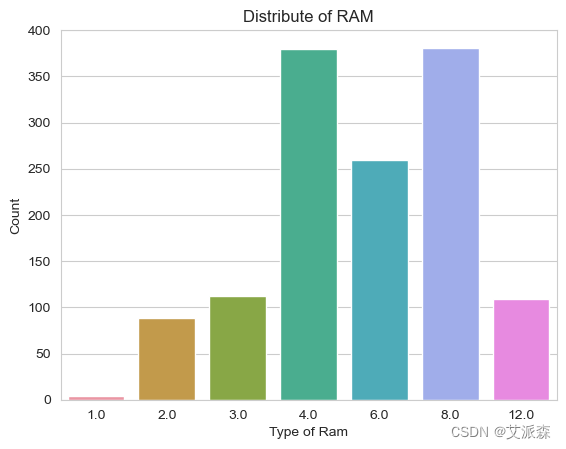
sns.set_palette("RdBu")
plt.title("Distribute of RAM")
sns.countplot(data = df ,x="RAM")
plt.xlabel("Type of Ram")
plt.ylabel("Count")
plt.show()
sns.set_palette("RdBu")
plt.title("Distribute of Storage")
sns.countplot(data = df ,x="Storage")
plt.xlabel("Type of Storage")
plt.ylabel("Count")
plt.show()
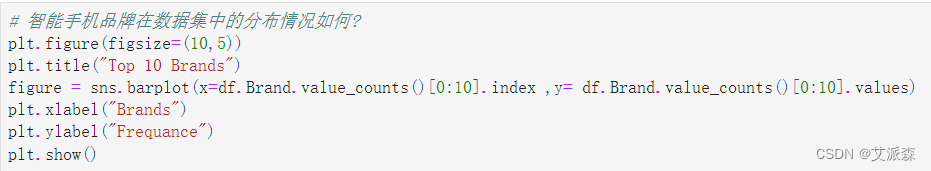
# 智能手机品牌在数据集中的分布情况如何?
plt.figure(figsize=(10,5))
plt.title("Top 10 Brands")
figure = sns.barplot(x=df.Brand.value_counts()[0:10].index ,y= df.Brand.value_counts()[0:10].values)
plt.xlabel("Brands")
plt.ylabel("Frequance")
plt.show()
前五名是:
1 -三星
2-Xiaomi
3-Apple
4-Realme
5-OPPO
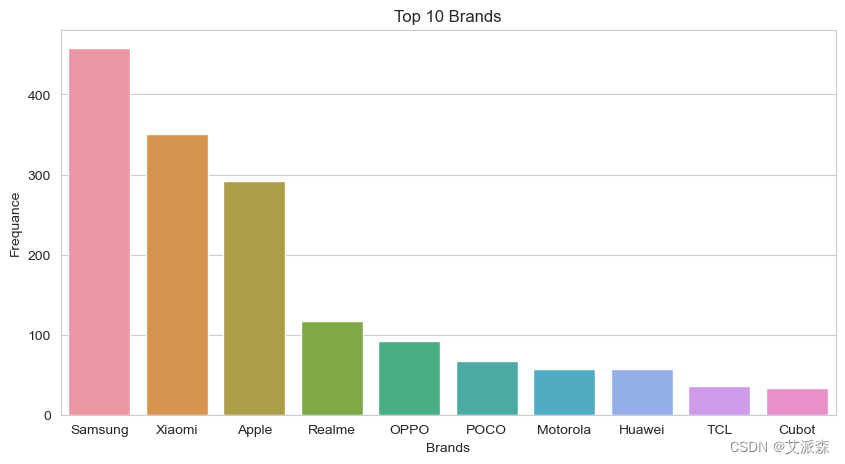
# 哪个智能手机品牌的平均价格最高?
fig ,ax =plt.subplots(nrows=1 ,ncols= 2 ,sharex=True, figsize=(20,10) )
fig.set_label("avg.Price of Brand")
#ax[0]
figure = sns.barplot(x =df.groupby("Brand")["Final Price"].mean().sort_values(ascending=False).round(3)[0:5].index ,
y=df.groupby("Brand")["Final Price"].mean().sort_values(ascending=False).round(3)[0:5].values ,
ax= ax[1])
ax[0].set_ylabel("avg.Price",fontsize=30)
ax[0].set_xlabel("Brand",fontsize=30)
#ax[1]
ax[0].plot(df.groupby("Brand")["Final Price"].mean().sort_values(ascending=False).round(3)[0:5].index ,
df.groupby("Brand")["Final Price"].mean().sort_values(ascending=False).round(3)[0:5].values ,
"o--")
ax[1].set_ylabel("avg.Price",fontsize=30)
ax[1].set_xlabel("Brand",fontsize=30)
plt.show()
平均价格最高的前5款智能手机是:
1-Apple
2-Lenovo
3-Asus
4-Realme
5-Samsung
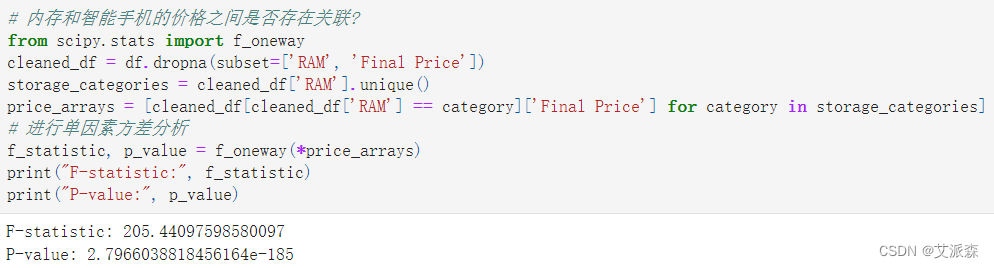
# 内存和智能手机的价格之间是否存在关联?
from scipy.stats import f_oneway
cleaned_df = df.dropna(subset=['RAM', 'Final Price'])
storage_categories = cleaned_df['RAM'].unique()
price_arrays = [cleaned_df[cleaned_df['RAM'] == category]['Final Price'] for category in storage_categories]
# 进行单因素方差分析
f_statistic, p_value = f_oneway(*price_arrays)
print("F-statistic:", f_statistic)
print("P-value:", p_value)
智能手机的价格因内存类别的不同而有很大差异。
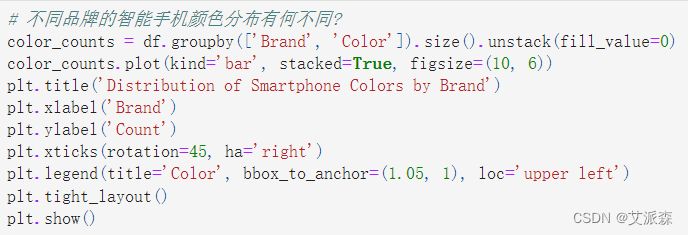
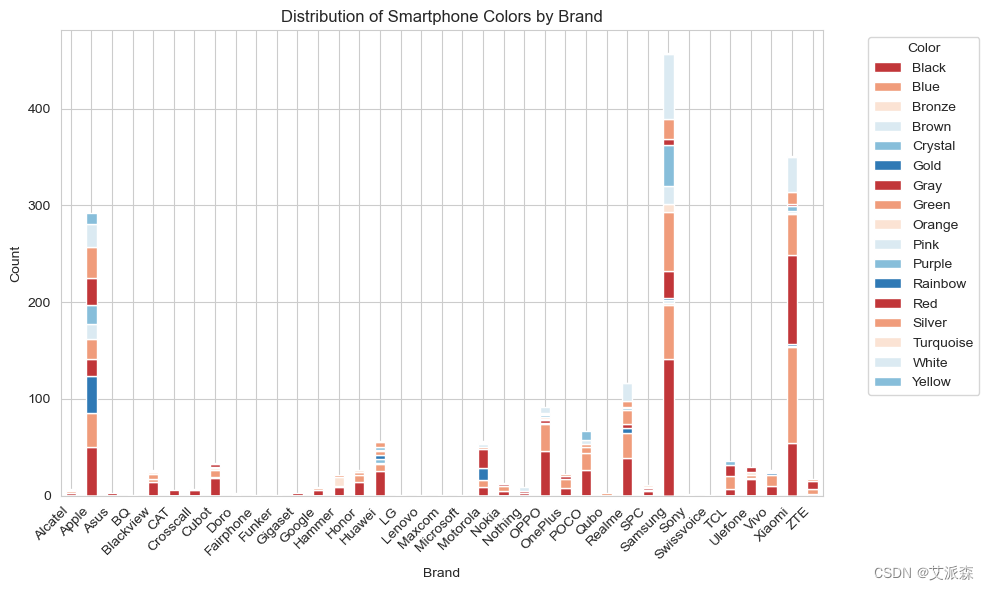
# 不同品牌的智能手机颜色分布有何不同?
color_counts = df.groupby(['Brand', 'Color']).size().unstack(fill_value=0)
color_counts.plot(kind='bar', stacked=True, figsize=(10, 6))
plt.title('Distribution of Smartphone Colors by Brand')
plt.xlabel('Brand')
plt.ylabel('Count')
plt.xticks(rotation=45, ha='right')
plt.legend(title='Color', bbox_to_anchor=(1.05, 1), loc='upper left')
plt.tight_layout()
plt.show()
- 1.
- 2.
- 3.
- 4.
- 5.
- 6.
- 7.
- 8.
- 9.
- 10.
- 11.
- 12.
- 13.
- 14.
- 15.
- 16.
- 17.
- 18.
- 19.
- 20.
- 21.
- 22.
- 23.
- 24.
- 25.
- 26.
- 27.
- 28.
- 29.
- 30.
- 31.
- 32.
- 33.
- 34.
- 35.
- 36.
- 37.
- 38.
- 39.
- 40.
- 41.
- 42.
- 43.
- 44.
- 45.
- 46.
- 47.
- 48.
- 49.
- 50.
- 51.
- 52.
- 53.
- 54.
- 55.
- 56.
- 57.
- 58.
- 59.
- 60.
- 61.
- 62.
- 63.
- 64.
- 65.
- 66.
- 67.
- 68.
- 69.
- 70.
- 71.
- 72.
- 73.
- 74.
- 75.
- 76.
- 77.
- 78.
- 79.
- 80.
- 81.
- 82.
- 83.
- 84.
- 85.
- 86.
- 87.
- 88.
- 89.
- 90.
- 91.
- 92.
- 93.
- 94.
- 95.
- 96.
- 97.
- 98.
- 99.
- 100.


 已为社区贡献41条内容

所有评论(0)