vscode使用xdebug3进行PHP调试
使用xdebug:下载https://xdebug.org/download配置:打开php.ini文件,在文件最后添加:(3.0的配置项有些改了)[XDebug]zend_extension = php_xdebug-3.0.2-7.4-vc15-nts-x86_64.dllxdebug.output_dir="D:\Work\php\xdebug\output"xdebug.mode = de
安装
Xdebug
下载

或在这里输入PHP的信息给出推荐的版本:Xdebug: Support — Tailored Installation Instructions

安装好vscode后安装Xdebug扩展

添加调试配置:
注意:port = xdebug的默认端口是9003,如果需要改端口号,要与xdebug的配置相同(xdebug的端口号配置项:xdebug.client_port = 9100)  没有运行选项的,要先创建launch.json文件
{
    // 使用 IntelliSense 了解相关属性。
    // 悬停以查看现有属性的描述。
    // 欲了解更多信息,请访问: https://go.microsoft.com/fwlink/?linkid=830387
    "version": "0.2.0",
    "configurations": [
        {
            "name": "Listen for Xdebug",
            "type": "php",
            "request": "launch",
            "port": 9003  // 与php.ini中xdebug.client_port的一致!!
        },
        {
            "name": "Launch currently open script",
            "type": "php",
            "request": "launch",
            "program": "${file}",
            "cwd": "${fileDirname}",
            "port": 0,
            "runtimeArgs": [
                "-dxdebug.start_with_request=yes"
            ],
            "env": {
                "XDEBUG_MODE": "debug,develop",
                "XDEBUG_CONFIG": "client_port=${port}"
            }
        },
        {
            "name": "Launch Built-in web server",
            "type": "php",
            "request": "launch",
            "runtimeArgs": [
                "-dxdebug.mode=debug",
                "-dxdebug.start_with_request=yes",
                "-S",
                "localhost:8097",
                "router.php"
            ],
            "program": "",
            "cwd": "${workspaceRoot}/public",
            "port": 9003,  // 与php.ini中xdebug.client_port的一致!!
            "serverReadyAction": {
                "pattern": "Development Server \\(http://localhost:([0-9]+)\\) started",
                "uriFormat": "http://localhost:%s",
                "action": "openExternally"
            }
        }
    ]
}
Xdebug几个主要参数说明:
zend_extension
指定 Xdebug 扩展的加载路径。
zend_extension = /path/to/xdebug.so ; Linux/macOS 系统
zend_extension = C:\path\to\php_xdebug.dll ; Windows 系统
zend_extension = php_xdebug-3.0.2-7.4-vc15-nts-x86_64.dll; 放在php的ext目录中
xdebug.mode
指定 Xdebug 的运行模式,可同时启用多个模式(用逗号分隔)。
off:默认,关闭
debug:启用远程调试功能,允许通过 IDE 进行断点调试、变量监控等操作,替代旧版的xdebug.remote_enable=On。
profile:启用性能分析器,生成cachegrind.out文件供工具(如 QCacheGrind)分析代码性能,替代旧版的xdebug.profiler_enable=On。
coverage:启用代码覆盖率分析,常用于单元测试(如 PHPUnit),生成覆盖率报告
trace:启用函数调用跟踪,记录执行路径和参数,替代旧版的xdebug.auto_trace=On
xdebug.start_with_request = trigger
控制 Xdebug 何时启动(配合 xdebug.mode 使用)。
default:默认,根据模式自动判断。
yes:所有请求都会自动启动调试,无需手动触发,但可能导致性能开销。
trigger:仅当请求中包含特定参数(如 XDEBUG_SESSION=1)时才会启动调试,适合生产环境或按需调试。
no:完全禁用自动调试启动
xdebug.output_dir="D:\Work\php\xdebug\output"
用于指定调试和分析文件的输出目录,该目录用于集中存放 Xdebug 生成的所有输出文件。
xdebug.client_host=127.0.0.1
指定调试客户端(如 IDE)的主机地址。
默认值:localhost
xdebug.client_port = 9003
指定调试客户端(IDE)监听的端口。
默认值:9003(3.x 版本变更,2.x 为 9000)
在php.ini中除了zend_extension、xdebug.mode要配置,其它都可以不配置。
在VSCode中配置Xdebug时,常见的三种调试模式及其作用
Listen for Xdebug
该模式用于监听Xdebug扩展发送的调试请求。当PHP脚本执行到断点时,Xdebug会主动连接到VSCode的指定端口(默认9003)传输调试信息。
此种模式Xdebug也是被动等待请求到来,请求到来后通过xdebug.start_with_request的值判断是否启动调试,这一项的值可以写到php.ini中,也可以由命令行指定。
可以按需启动调试方法如下:
要调试http请求时,只需要在地址带上XDEBUG_SESSION,如:http://xxx/?XDEBUG_SESSION=abc
要调试命令行时,只需要在命令中加入参数:php -dxdebug.mode=debug -dxdebug.start_with_request=yes -dxdebug.client_port=9003 think test
Launch currently open script
此模式直接调试当前在VSCode中打开的PHP脚本文件,无需Web服务器。它会通过PHP CLI运行当前文件并附加Xdebug调试器,适合调试命令行工具或独立脚本。
Launch Built-in web server
该模式启动PHP内置开发服务器并自动启动Xdebug调试。
runtimeArgs参数中需要指定下服务的端口号,例:localhost:8097
如果需要url重写,则在runtimeArgs参数中添加“router.php”,thinkphp的public目录下默认有这个文件。
cwd参数指定项目的根目录,例如thinkphp的:${workspaceRoot}/public
router.php文件内容如下:
<?php
// +----------------------------------------------------------------------
// | ThinkPHP [ WE CAN DO IT JUST THINK ]
// +----------------------------------------------------------------------
// | Copyright (c) 2006~2019 http://thinkphp.cn All rights reserved.
// +----------------------------------------------------------------------
// | Licensed ( http://www.apache.org/licenses/LICENSE-2.0 )
// +----------------------------------------------------------------------
// | Author: liu21st <liu21st@gmail.com>
// +----------------------------------------------------------------------
// $Id$

if (is_file($_SERVER["DOCUMENT_ROOT"] . $_SERVER["SCRIPT_NAME"])) {
    return false;
} else {
    $_SERVER["SCRIPT_FILENAME"] = __DIR__ . '/index.php';

    require __DIR__ . "/index.php";
}
系统中存在多个版本的PHP时,指定使用哪个版本运行调试:
在vscode的配置中查找“php.debug.executablePath”,指定PHP的运行文件:
"php.debug.executablePath": "D:\\soft\\php\\windows\\php-8.2.29-nts-Win32-vs16-x64\\php.exe",
因为每个项目的可能需要的PHP版本不同,所以有特定版本要求的最好单独指定到本项目的工作区的配置中。
PHP配置:
首先设置运行时长:
max_execution_time = 3600,开发环境下可以设置长一些,设置太短还没走完就停止运行了。或设置为0。
打开php.ini文件,在文件最后添加:(3.0的配置项有些改了)
[XDebug]
zend_extension = php_xdebug-3.0.2-7.4-vc15-nts-x86_64.dll
xdebug.mode = debug,coverage
xdebug.output_dir="D:\Work\php\xdebug\output"
xdebug.start_with_request = trigger
xdebug.client_port = 9003
php_xdebug-3.0.2-7.4-vc15-nts-x86_64.dll文件放在php的ext目录下可以使用相对路径。
这里使用的端口号是默认的9003,如需改添加端口配置项:
xdebug.client_port = 9100(指的是调试工具的端口,XDebug将会往这个端口中发送调试消息。如:vscode的PHP Debug)
xdebug.start_with_request 指定xdebug的启动方式,可选值:
- yes 任何请求都启动。(这种方式对所有访问都会启动调试,浏览器直接访问的情况下会报:Xdebug: [Step Debug] Time-out connecting to debugging client。想要正常访问必须先启动调试工具,如:vscode的PHP Debug。)
PHP启动后,只要有PHP运行都往客户端的端口发调试消息。建议使用trigger方式。 - trigger 请求中有参数(XDEBUG_SESSION)才启动,可以是get/post请求:http://a.com/?XDEBUG_SESSION=abc。参数值可以任意,除非设置了xdebug.trigger_value。参考:Xdebug 3.0 WSL2 和 VSCode - 有效的配置答案 - 爱码网
用浏览器可以用这种方式启动监听,带了参数的请求才往客户端的端口发送调试消息。仅个别代码需要调试时建议使用这种。
参考:Xdebug: Documentation » Step Debugging
调试
vscode默认的3种配置应该如何使用?
- Listen for Xdebug:调试命令行。
- Launch currently open script:调试当前脚本。
- Launch Built-in web server:调试web页。
确认php.ini中已经打开了调试模式
xdebug.mode = debug
先将vscode中的对应的调试运行起来。
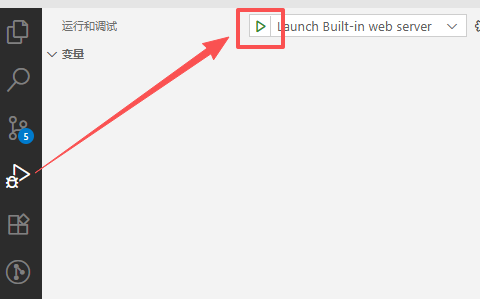
模式:Listen for XDebug
主要用来调试命令行,也可以调试web。

1.调试命令行
使用参数启动调试:
php -dxdebug.start_with_request=yes think test
# 其它参数都在php.ini配置好,并不需要修改时
php -dxdebug.start_with_request=yes think test

# powershell要把参数引起来,否则报找不到文件
php "-dxdebug.start_with_request=yes" think test

# 调试参数要单独指定时
php -dxdebug.mode=debug -dxdebug.start_with_request=yes -dxdebug.client_port=9004 think test2.调试web
启动web服务器,端口号可以自定义,不影响调试。这里使用的php的内部web服务器,任意web服务都可以。
php -S localhost:8001
启动调试:(这时vscode还没有捕获断点)

打开浏览器,访问:http://localhost:8001/a.php?XDEBUG_SESSION=vscode

浏览器一直在转等输出,vscode进入调试状态。

模式:Launch currently open script
调试当前打开的文件。

在要调试的文件中打上断点,按F5启动调试(或 运行->启动调试),进入调试状态。

参考:
vscode使用xdebug3调试PHP脚本_raoxiaoya的博客-CSDN博客
模式:Launch Built-in web server
调试web。
运行调试时会运行指定的运行目录指定的php.exe,并打开浏览器访问:http://localhost:8097/,如果代码有打断点,将会停在断点处。

如果页面是其它地址可手动输入并访问:http://localhost:8097/Article.Index,这个地址是通过router.php经过url重写的

多版本配置
如果开发环境中有多个PHP版本,需要指定特定版本运行调试,则需要配置:


CLI(命令行)方式调试
- vscode 启动调试:Listen for Xdebug
- 命令行运行命令:
php -dxdebug.mode=debug -dxdebug.start_with_request=yes -dxdebug.client_port=9004 think test-dxdebug.client_port=9004 是xdebug客户端的端口(即vscode的调试器端口)
xdebug.mode=debug 如果在php.ini中没有配置,命令行中要指定

腾讯云面向开发者汇聚海量精品云计算使用和开发经验,营造开放的云计算技术生态圈。
更多推荐
 3
3 0
0- 0


 已为社区贡献1条内容

所有评论(0)