【Python/机器学习/深度学习】学习笔记1——零基础入门Python数据分析【Anaconda3-JupyterNotebook&seaborn版】
登录anaconda官网点击免费下载如果不想改盘可以直接无脑安装在C盘安装好后可以使用图形化导航启动(但是不提倡这种方式:一是因为图像化软件占用内存。二是运行缓慢)更推荐下面这种运行方式:命令行窗口启动项目转移到工作目录输入dir指令可以看到文件下面的全部项目目录使用命令行输入指令:jupyter notebook可以看到浏览器端显示出磁盘下面相同的目录解决JuPyter500:Internal
视频链接:https://www.youtube.com/watch?v=wsjbXSbVrAU&list=PLGkfh2EpdoKU3OssXkTl3y7c9tw7jjvHm&index=1
课件内容:
GitHub - rayc2020/LessonPythonCode: LessonPythonCode
链接:https://pan.baidu.com/s/1DkjmmMTXbPeTfQJs_hghwg
提取码:ipko
--来自百度网盘超级会员V4的分享
目录
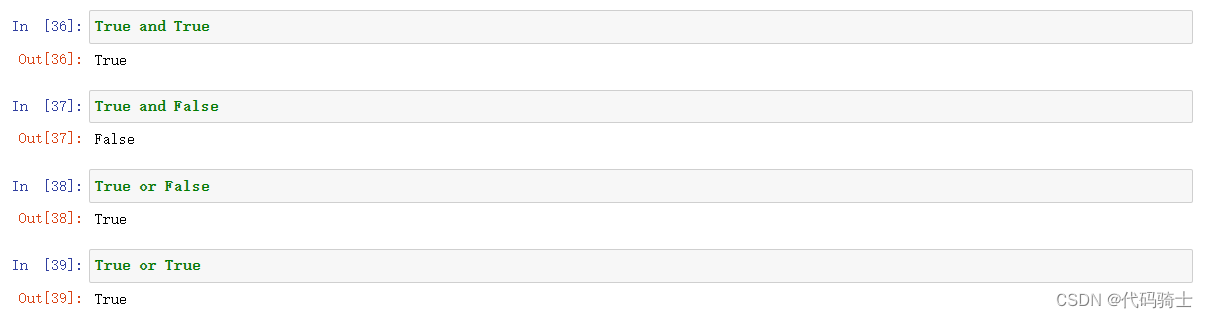
(2)Boolean and Logical Operators
(3)Variable变量及Variables Assigment变量分配
编辑 difference_update求差集并更新集合函数
P4-Pandas csv,json,html,excel,pickle
Using loc or iloc to access the elements
pd.read_csv(StringIO(str))函数以csv模式读字符串
pd.read_csv(StringIO(data))函数将字符串保存到csv表格类型
设置表格索引列数据的数据类型(将原本的str转换成所需要的类型)
convert Json to different json formats
(3)Pandas Reading HTML content
P8-Lambda, Map, Filter, List Comprehension
P9- String, Iterables vs Iterators, Pyforest
P10-Classes, Variables, Methods and Objects
P11-Univariate,Bivariate,MultiVariate Analysis & Histograms单变量,双变量,多变量分析及柱状图
P0-安装环境与Jupyter的使用
前言说明


登录anaconda官网
Anaconda | The World’s Most Popular Data Science Platform
点击免费下载


如果不想改盘可以直接无脑安装在C盘

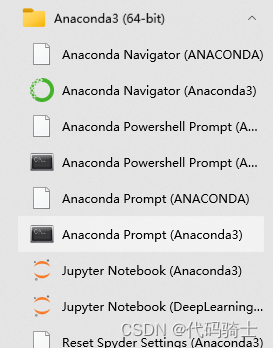
安装好后可以使用图形化导航启动(但是不提倡这种方式:一是因为图像化软件占用内存。二是运行缓慢)


更推荐下面这种运行方式:
命令行窗口启动项目

转移到工作目录

输入dir指令可以看到文件下面的全部项目目录

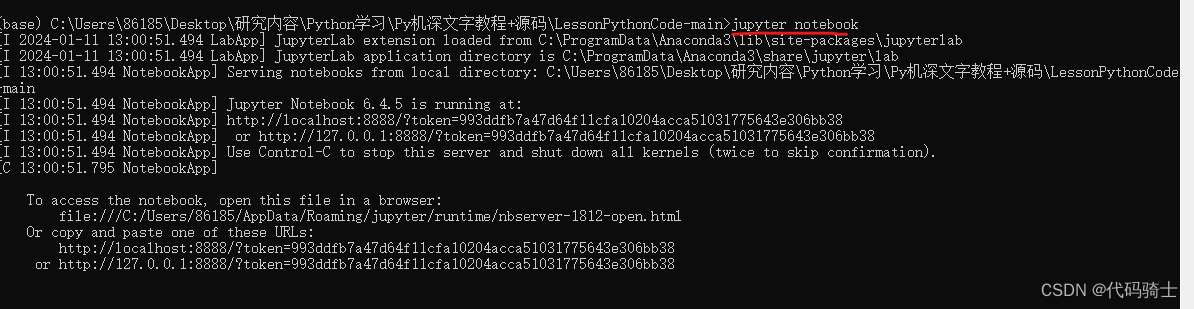
使用命令行输入指令:jupyter notebook

可以看到浏览器端显示出磁盘下面相同的目录

如果启用jupyter遇到报错500的问题,参考以下方案:
解决JuPyter500:Internal Server Error问题-CSDN博客
新建.ipynb即可进行笔记、编译、运行代码。

选择代码块,shift+enter可以快速运行代码

P1-基础语法及操作
What is Python?
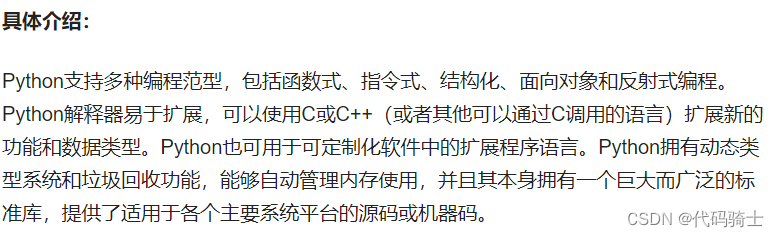
Python is an interpreted, interactive, object-oriented programming language. It incorporates modules, exceptions, dynamic typing, very high level dynamic data types, and classes. Python combines remarkable power with very clear syntax. It has interfaces to many system calls and libraries, as well as to various window systems, and is extensible in C or C++. It is also usable as an extension language for applications that need a programmable interface. Finally, Python is portable: it runs on many Unix variants, on the Mac, and on PCs under MS-DOS, Windows, Windows NT, and OS/2.
Python Installation安装 from Anaconda | The World’s Most Popular Data Science Platform
With over 20 million users worldwide, the open-source Individual Edition (Distribution) is the easiest way to perform Python/R data science and machine learning on a single machine.
Python Practice动手实践
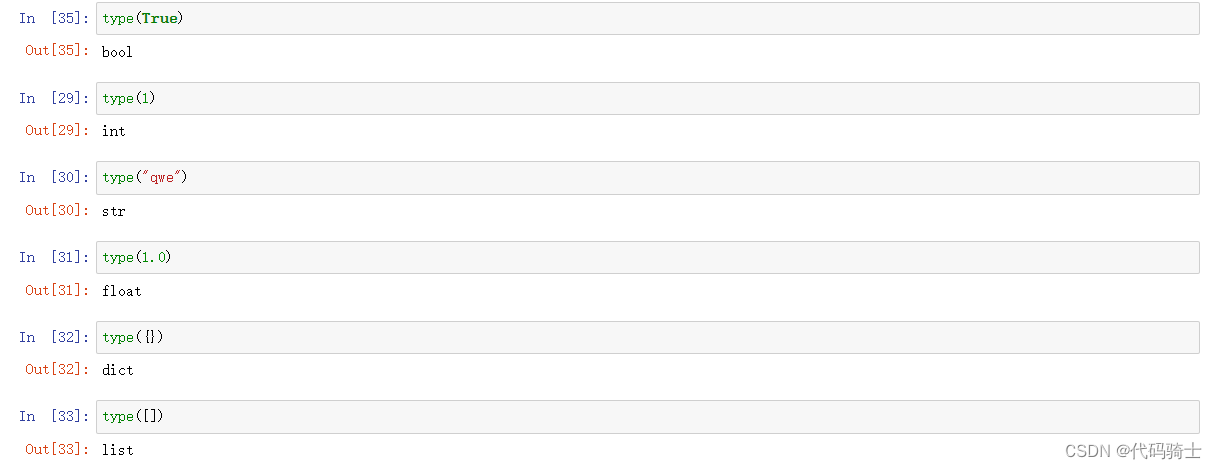
(1)Data Types数据类型
(2)Variable变量及Variables Assigment变量分配
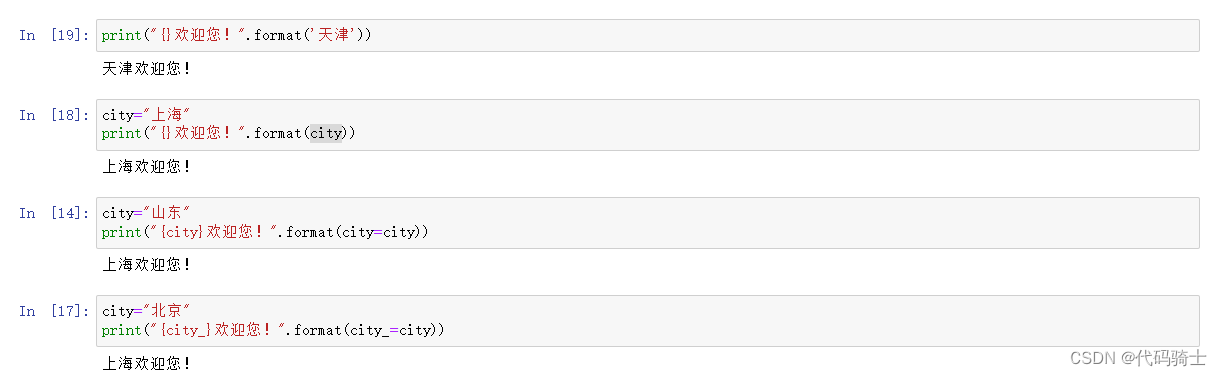
(3)Print Formatting打印函数
Raw NBConvert——这是一个可将你的笔记本转换成另一种格式(比如HTML)的命令行工具。 Heading——这是你添加标题的地方,这样你可以将不同的章节分开,让你的笔记本看起来更整齐更清晰。 这个现在已经被转换成Markdown 选项本身了。 输入一个「##」之后,后面输入的内容就会被视为一个标题。
Jupyter notebook快捷键操作大全
**常用的有:
A——向上添加单元格;B——向下添加单元格;X——剪切单元格
shift+回车——运行代码块;编译模式下:shift+tab——查看函数功能
选中代码按下Tab键——代码整体缩进一格
ctrl+/——快速注释
命令行模式(按 Esc 生效)编辑快捷键
F: 查找并且替换
Ctrl-Shift-F: 打开命令配置
Ctrl-Shift-P: 打开命令配置
Enter: 进入编辑模式
P: 打开命令配置
Shift-Enter: 运行单元格, 选择下面的单元格
Ctrl-Enter: 运行选中的单元格
Alt-Enter: 运行单元格并且在下面插入单元格
Y: 把单元格变成代码快
M: 把单元格变成 Markdown
R: 清除单元格格式
1: 把单元格变成标题 1
2: 把单元格变成标题 2
3: 把单元格变成标题 3
4: 把单元格变成标题 4
5: 把单元格变成标题 5
6: 把单元格变成标题 6
K: 选择上面的单元格
上: 选择上面的单元格
下: 选择下面的单元格
J: 选择下面的单元格
Shift-K: 扩展上面选择的单元格
Shift-上: 扩展上面选择的单元格
Shift-下: 扩展下面选择的单元格
Shift-J: 扩展下面选择的单元格
Ctrl-A: select all cells
A: 在上面插入单元格
B: 在下面插入单元格
X: 剪切选择的单元格
C: 复制选择的单元格
Shift-V: 粘贴到上面
V: 粘贴到下面
Z: 撤销删除单元格
D,D: 删除选中单元格
Shift-M: 合并选中单元格, 如果只有一个单元格被选中
Ctrl-S: 保存并建立检查点
S: 保存并建立检查点
L: 切换行号
O: 显示/隐藏选定单元格的输出
Shift-O: 切换选中单元格的输出为滚动
H: 显示键盘快捷键
I,I: 中断内核
0,0: 重启内核(带确认对话框)
Esc: 关闭分页器
Q: 关闭分页器
Shift-L: 在所有单元格中切换行号,并保持设置
Shift-空格: 向上滚动
空格: 向下滚动
编辑模式(按 Enter 生效)
Tab: 代码补全或缩进
Shift-Tab: 工具提示
Ctrl-]: 缩进
Ctrl-[: 取消缩进
Ctrl-A: 全选
Ctrl-Z: 撤销
Ctrl-/: 注释
Ctrl-D: 删除整行
Ctrl-U: 撤销选择
Insert: 切换重写标志
Ctrl-Home: 跳到单元格起始处
Ctrl-上: 跳到单元格起始处
Ctrl-End: 跳到单元格最后
Ctrl-下: 跳到单元格最后
Ctrl-左: 往左跳一个单词
Ctrl-右: 往右跳一个单词
Ctrl-退格: 删除前面的单词
Ctrl-Delete: 删除后面的单词
Ctrl-Y: 重做
Alt-U: 重新选择
Ctrl-M: 进入命令行模式
Ctrl-Shift-F: 打开命令配置
Ctrl-Shift-P: 打开命令配置
Esc: 进入命令行模式
Shift-Enter: 运行单元格, 选择下面的单元格
Ctrl-Enter: 运行选中的单元格
Alt-Enter: 运行单元格并且在下面插入单元格
Ctrl-Shift-Minus: split cell at cursor(s)
Ctrl-S: 保存并建立检查点
下: 光标下移
上: 光标上移
关闭资源整理自——jupyter notebook 快捷键 - 知乎
(1)DataTypes数据类型
(2)Boolean and Logical Operators
(3)Variable变量及Variables Assigment变量分配
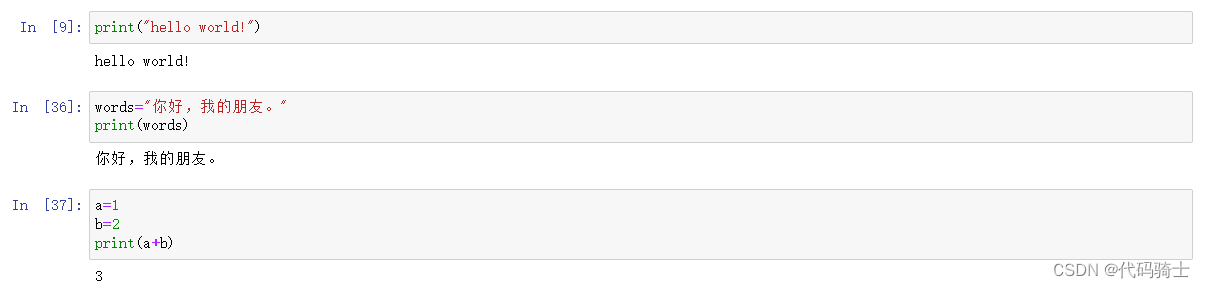
(4)Print Formatting打印
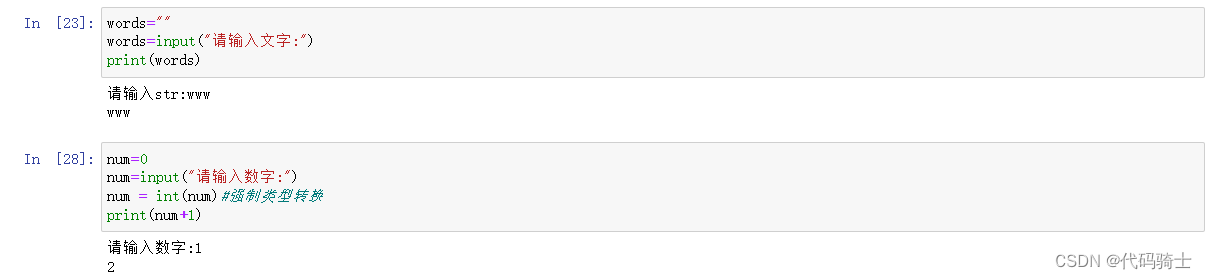
(5)input输入函数
P2-数据结构
(1)Str字符串
(2)Lists序列函数
(3)Sets集合函数
(4)Dictionaries字典函数
(5)Tuples元组函数
开始菜单找到Anaconda Prompt
进入工作目录:
cd d:——切换所在磁盘
cd [绝对/相对路径] ——切换目录
dir ——显示目录内容
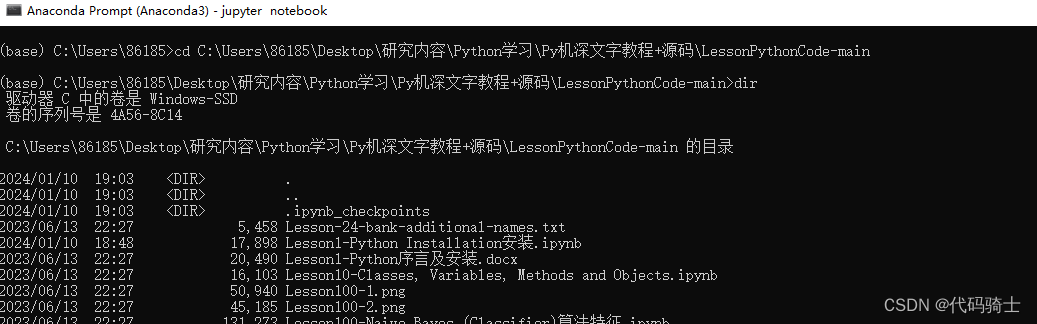
启动Jupyter Notebook:jupyter notebook
(1)str字符串

(2)Lists序列函数
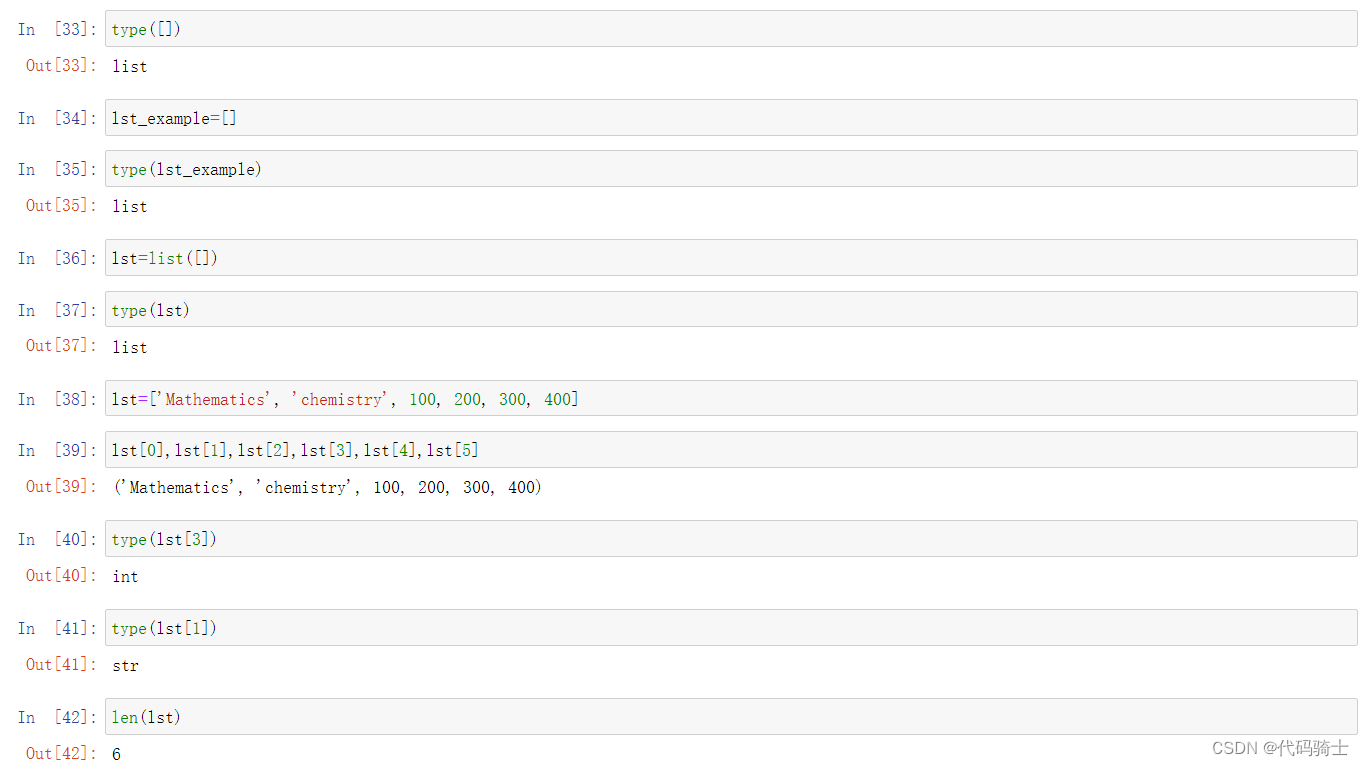
序列是Python中最基本的数据结构。序列中的每个元素都分配一个数字代表它的位置及索引,第一个索引是0,第二个索引是1,依此类推。
序列(list)也称列表,是最常用的Python数据类型,它可以作为一个方括号内的逗号分隔值出现。
创建一个序列,只要把逗号分隔的不同的数据项使用方括号括起来即可.
A list is a data structure in Python that is a mutable, or changeable, ordered sequence of elements. Each element or value that is inside of a list is called an item. Just as strings are defined as characters between quotes, lists are defined by having values between square brackets [ ]
列表赋值与打印
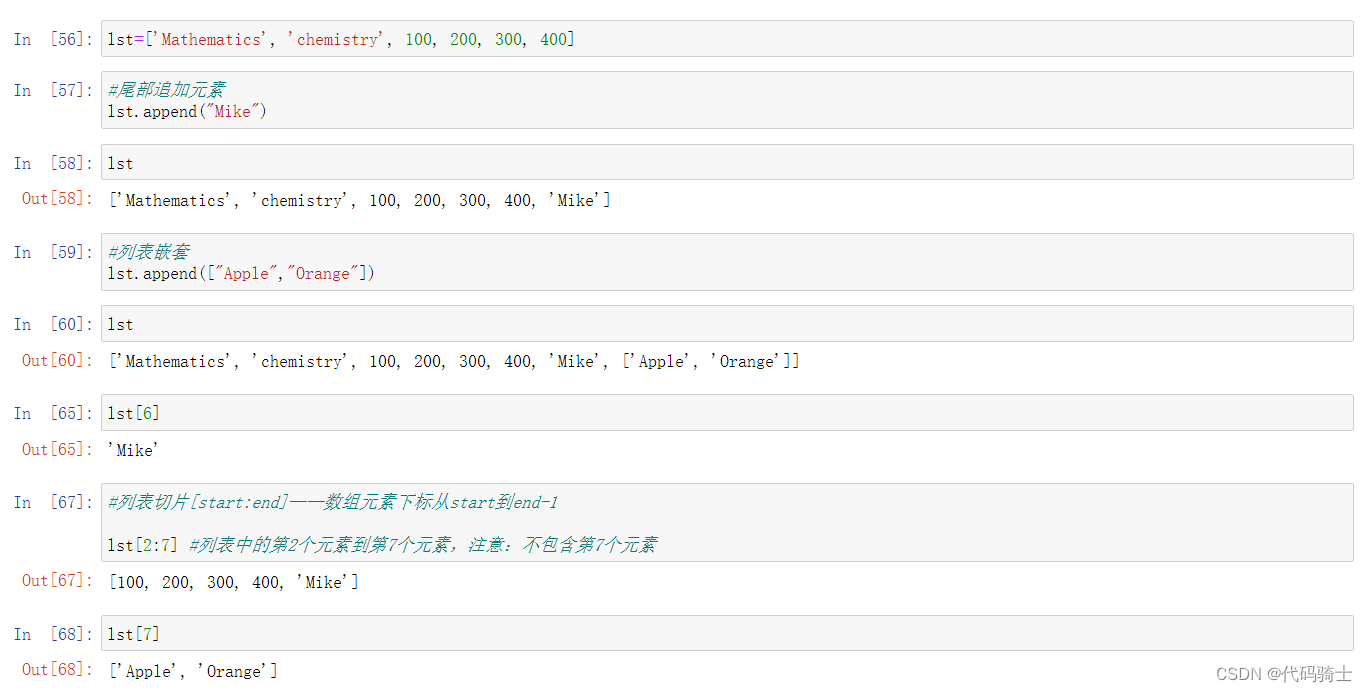
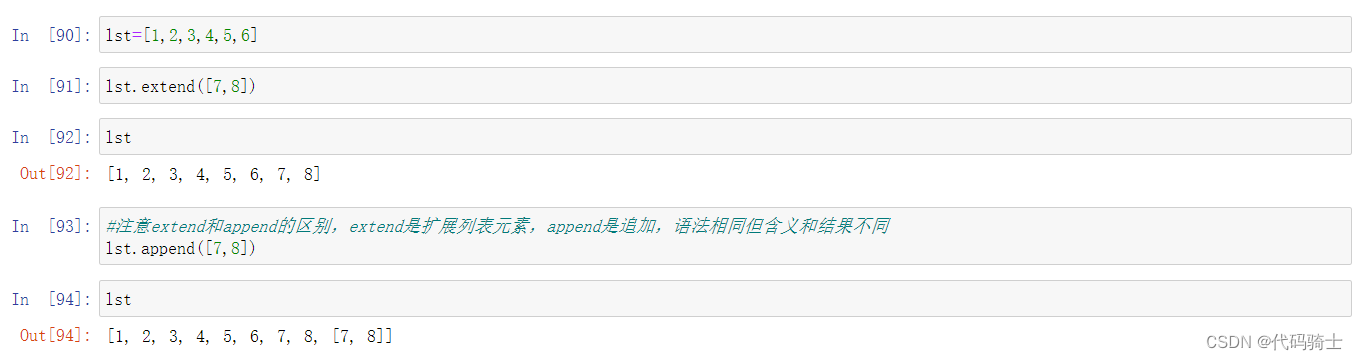
Append添加函数
Signature: lst.append(object, /)
Docstring: Append object to the end of the list.
Type:      builtin_function_or_method
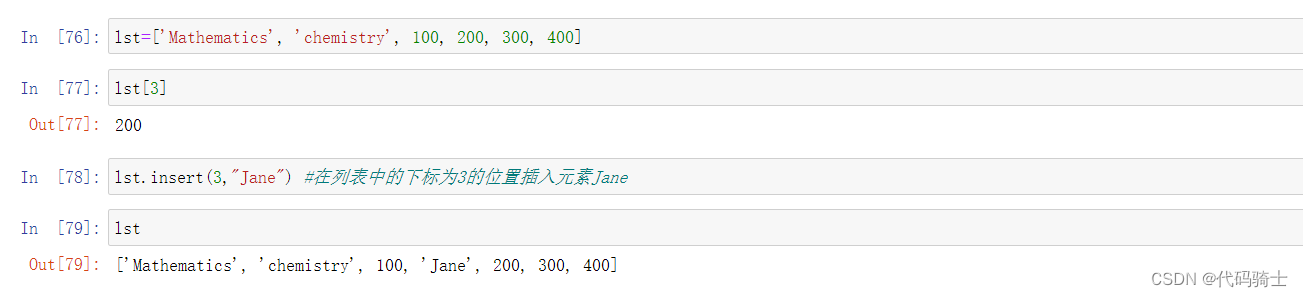
Insert插入函数
Signature: lst.insert(index, object, /)
Docstring: Insert object before index.
Type:      builtin_function_or_method
Extend扩展函数
Signature: lst.extend(iterable, /)
Docstring: Extend list by appending elements from the iterable.
Type:      builtin_function_or_method
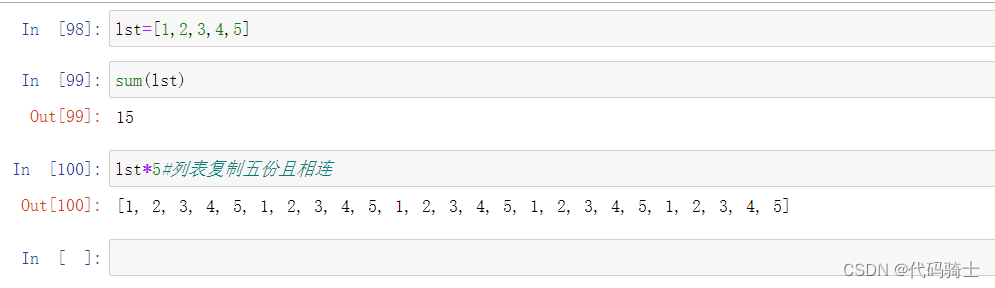
Sum求和函数
Signature: sum(iterable, /, start=0)
Docstring:
Return the sum of a 'start' value (default: 0) plus an iterable of numbers
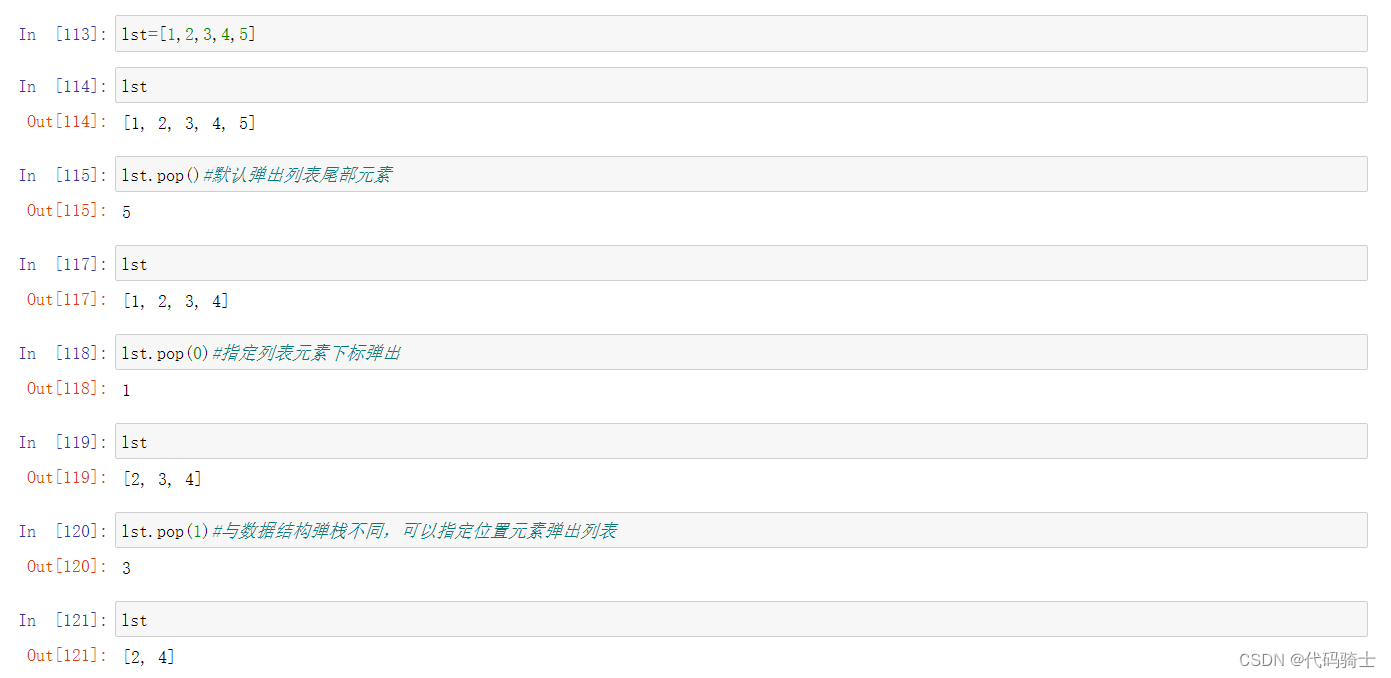
Pop函数
Signature: lst.pop(index=-1, /)
Docstring:
Remove and return item at index (default last).
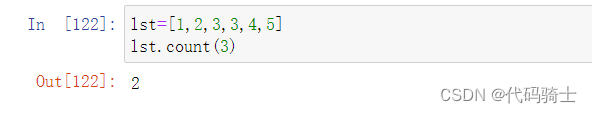
Count函数
Signature: lst.count(value, /)
Docstring: Return number of occurrences of value.
Type:      builtin_function_or_method
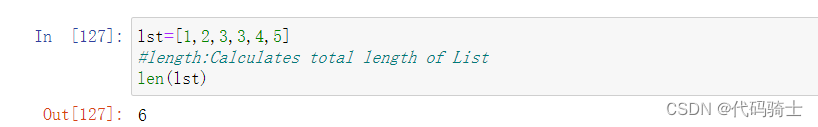
Len函数
Signature: len(obj, /)
Docstring: Return the number of items in a container.
Type:      builtin_function_or_method
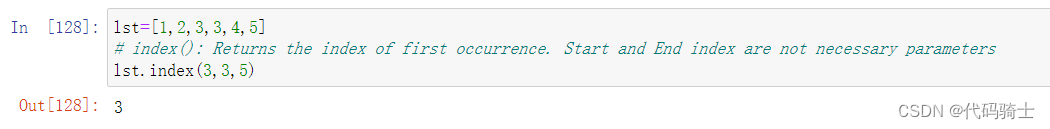
Index函数
Signature: lst.index(value, start=0, stop=9223372036854775807, /)
Docstring:
Return first index of value.
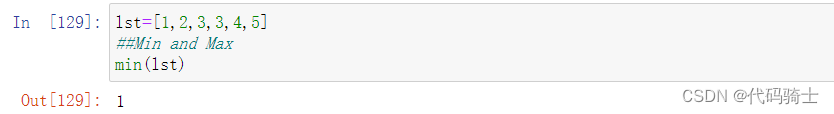
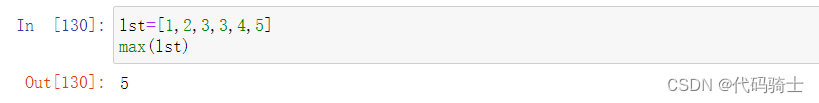
Min、Max函数
Docstring:
min(iterable, *[, default=obj, key=func]) -> value
min(arg1, arg2, *args, *[, key=func]) -> value
Docstring:
max(iterable, *[, default=obj, key=func]) -> value
max(arg1, arg2, *args, *[, key=func]) -> value
(3)Sets集合函数
创建一个无序不重复元素集,可进行关系测试,删除重复数据,还可以计算交集、差集、并集等。
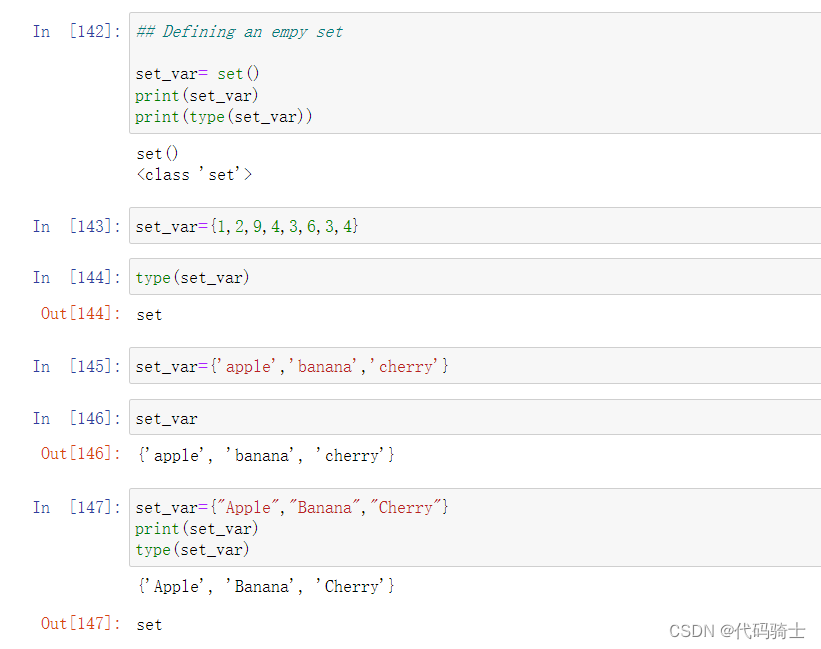
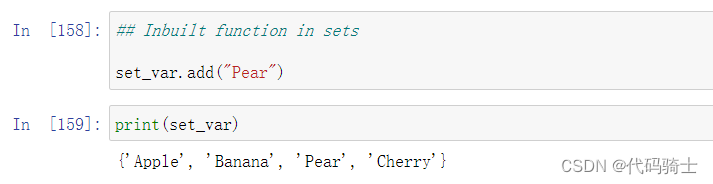
Add添加函数
Docstring:
Add an element to a set.

This has no effect if the element is already present.
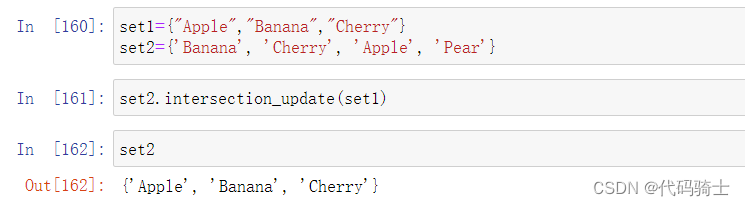
Intersection_update求交集并更新集合函数
Docstring: Update a set with the intersection of itself and another.
Type:      builtin_function_or_method
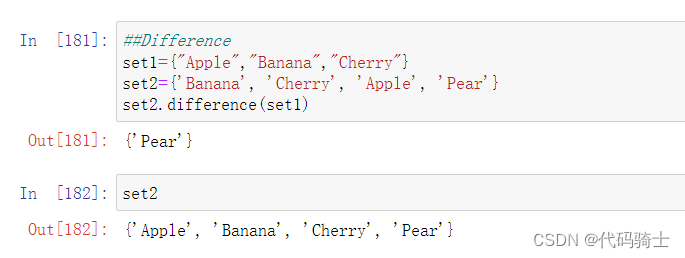
difference求差集函数
Docstring:
Return the difference of two or more sets as a new set.

(i.e. all elements that are in this set but not the others.)
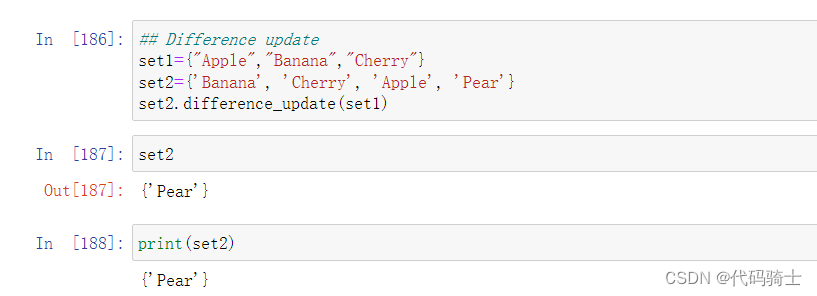
 difference_update求差集并更新集合函数
Docstring: Remove all elements of another set from this set.
Type:      builtin_function_or_method
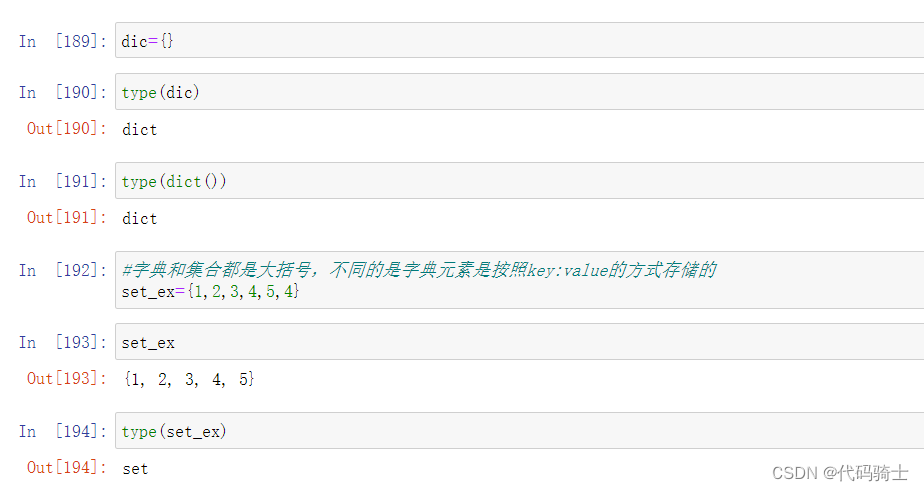
(4)Dictionaries字典函数
Python字典是一种可变容器函数,且可存储任意类型对象,如字符串、数字、元组等其他容器模型。
字典由键和对应值成对组成。字典也被称作关联数组或哈希表
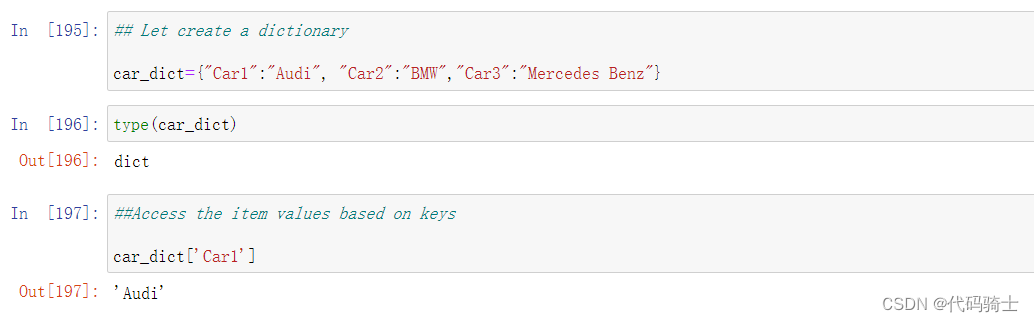
A dictionary is a collection which is unordered, changeable and indexed. In Python dictionaries are written with curly brackets, and they have keys and values.
和集合的区别
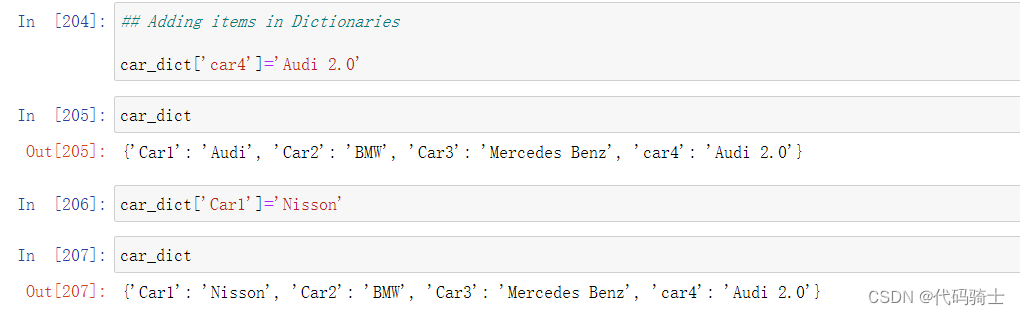
字典的创建、赋值和打印
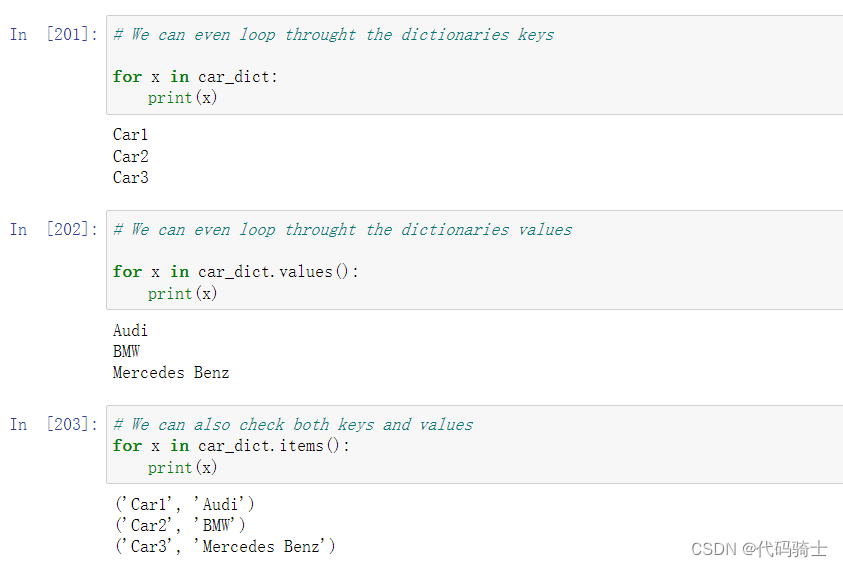
 字典的遍历
字典的遍历
字典元素的添加与修改
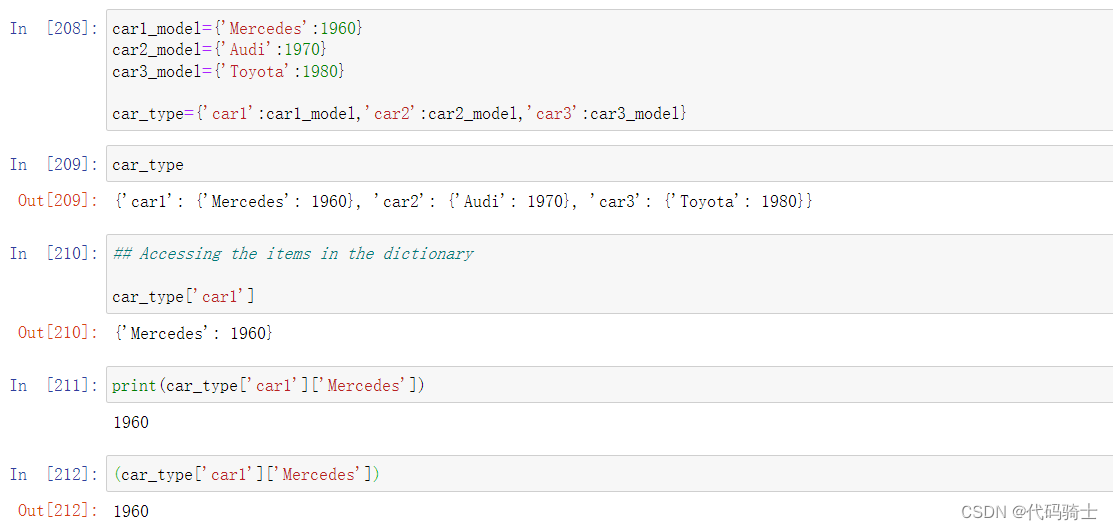
Nested Dictionary嵌套字典
(5)Tuples元组函数
Python的元组与列表类似,不同之处在于元组的元素不能修改。
元组使用圆括号,列表使用方括号。
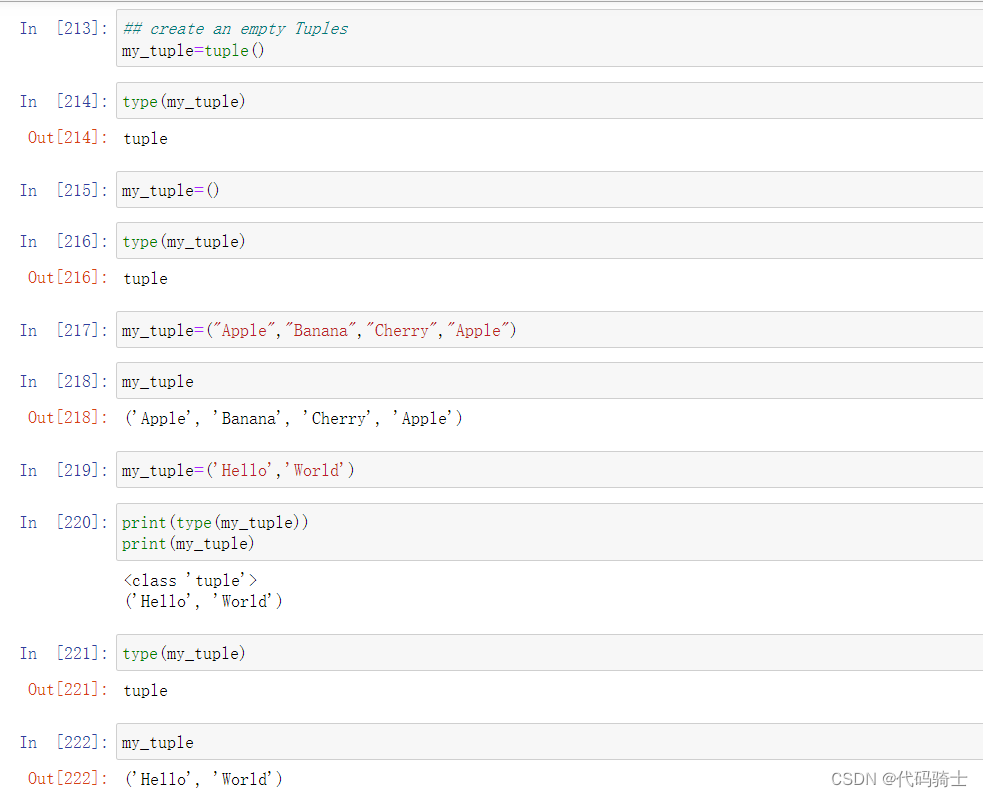
元组创建很简单,只需要在括号中添加元素,并使用逗号隔开即可
创建元祖、赋值与打印
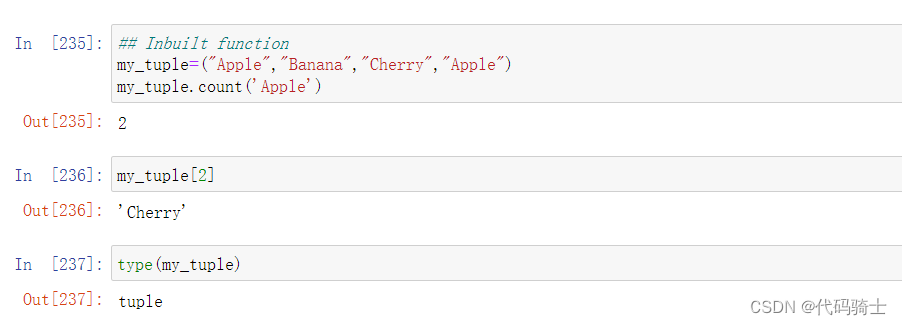
cout函数
Signature: my_tuple.count(value, /)
Docstring: Return number of occurrences of value.
Type:      builtin_function_or_method
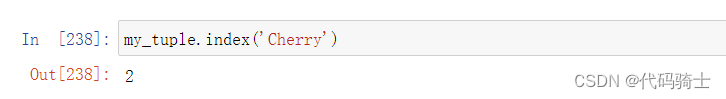
index函数
Signature: my_tuple.index(value, start=0, stop=9223372036854775807, /)
Docstring:
Return first index of value.
P3-Numpy和Seaborn
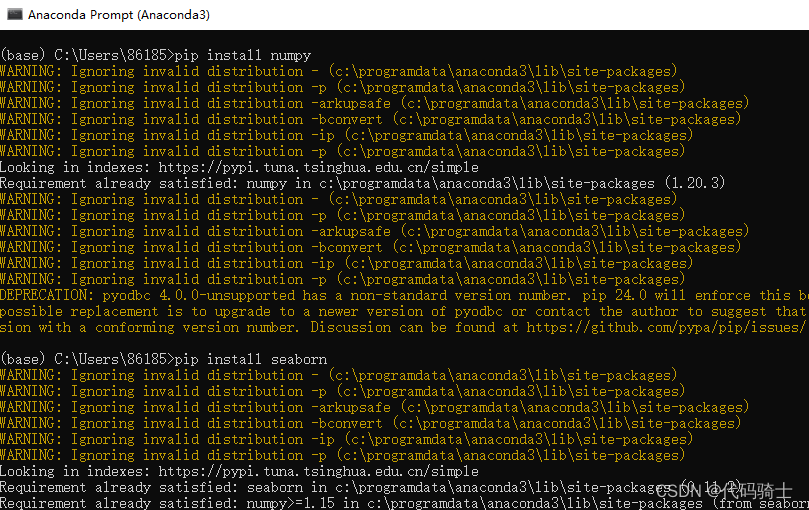
首先在anaconda命令行下安装:
pip install numpy 或者 conda install numpy
pip install seaborn 或者 conda install seaborn
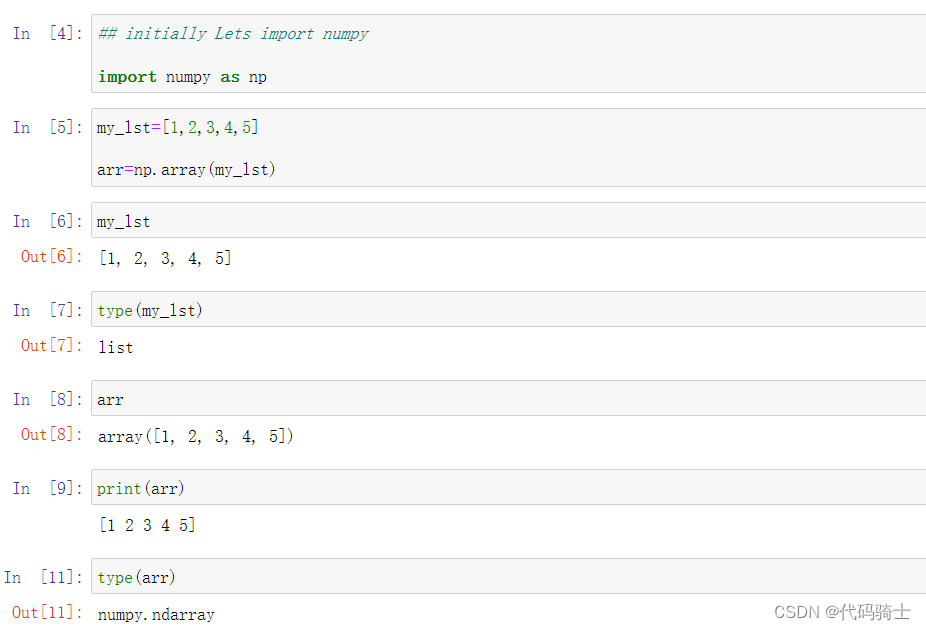
(1)NumPy是 Python 语言的一个扩展程序库,支持大量的维度数组与矩阵运算,此外也针对数组运算提供大量的数学函数库
NumPy is a general-purpose array-processing package. It provides a high-performance multidimensional array object, and tools for working with these arrays. It is the fundamental package for scientific computing with Python
An array is a data structure that stores values of same data type. In Python, this is the main difference between arrays and lists. While python lists can contain values corresponding to different data types, arrays in python can only contain values corresponding to same data type
(2)python数据可视化库seaborn
seaborn就是在matplotlib基础上面的封装,方便直接传参数调用
启动anaconda prompt在窗口中下载安装包:
pip install numpy 或者 conda install numpy
pip install seaborn 或者 conda install seaborn
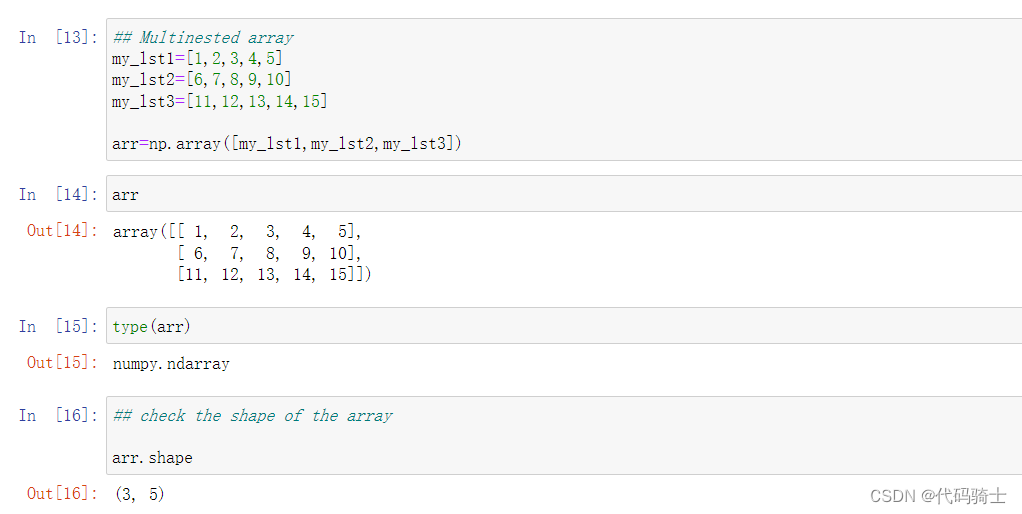
numpy.array函数将列表转化为一维矩阵
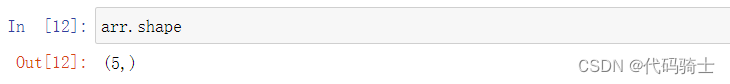
numpy.shape函数查看矩阵形状
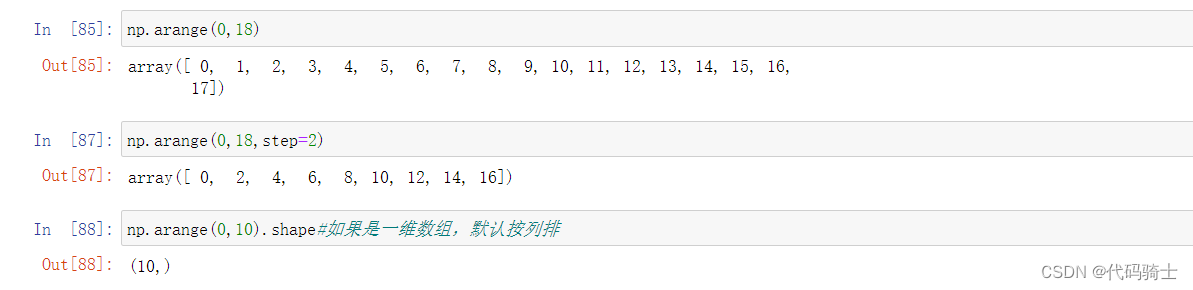
(a,b)表示a行b列,其中(a,)表示a行1列,1可省略。一维数组默认按列排(列向量)。
numpy.array函数将列表转化为多维矩阵
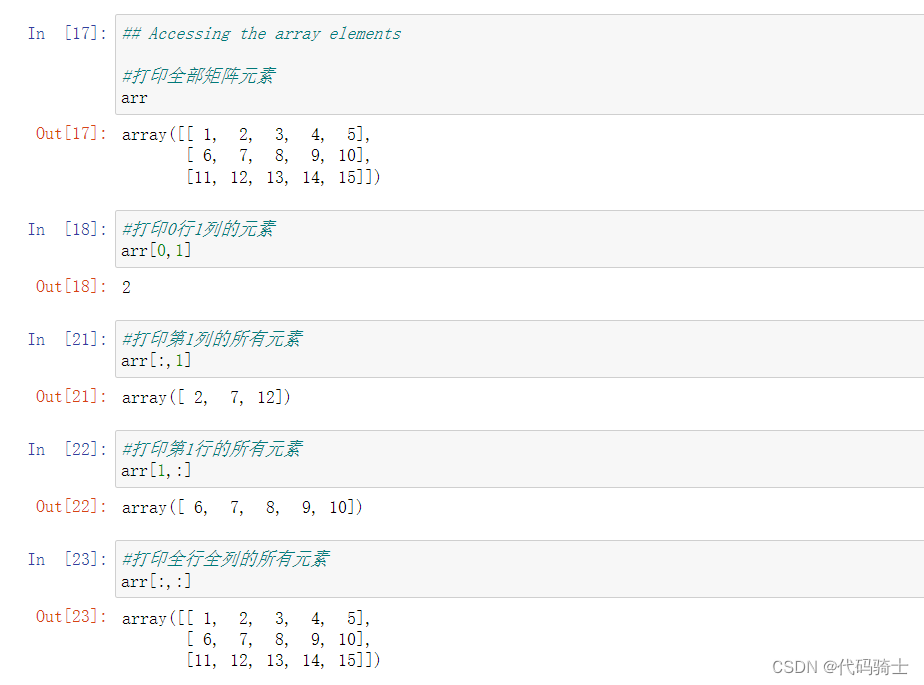
通过下标打印矩阵元素
arr[a,b]表示a行b列的元素
arr[:,b]表示第b整列的元素
arr[a,:]表示第a整行的元素
(注意中间逗号不要忘记加)
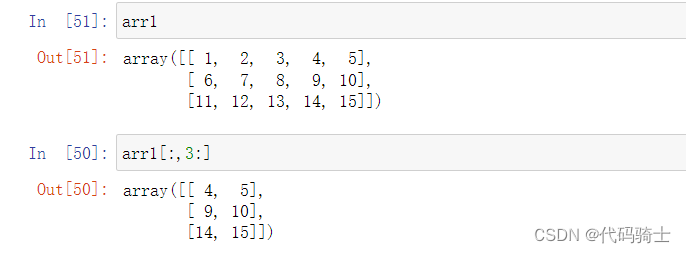
矩阵切片打印
arr[a:b,c:d]表示打印从下标a到下标b-1行,从下标c列到下标d-1列的元素。(可以理解为冒号前面表示物理下标,冒号后面表示逻辑下标。或者理解为从下标第a行到下标第b行但不包括第b行,从下标第c列到下标第d列但不包括第d列)
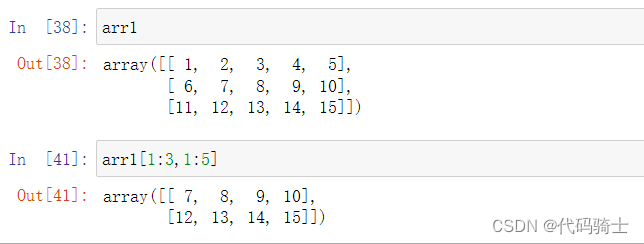
arr[a:,c:d]表示打印从下标a行到所有行,从下标c列到下标d-1列的元素。
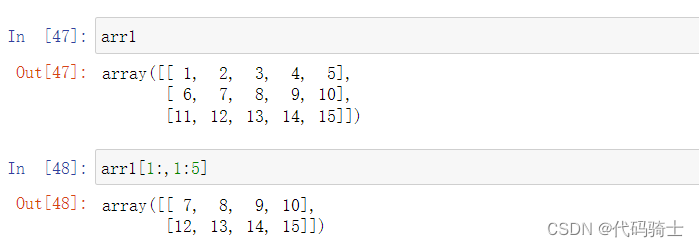
arr[:,c:]表示打印所有行,从下标c列到所有列的元素。
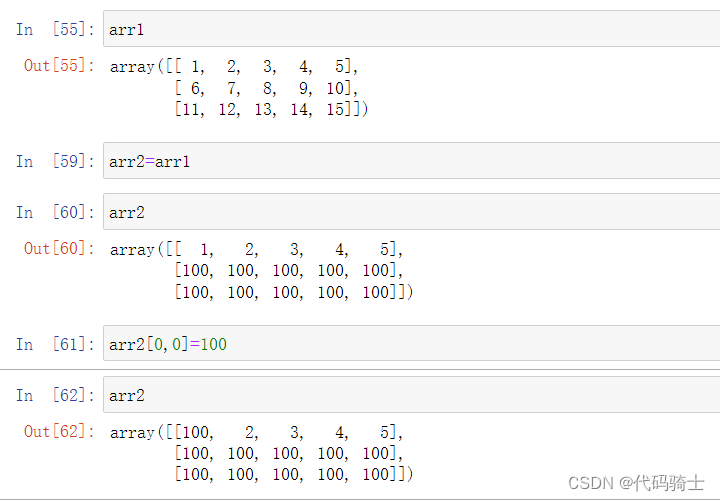
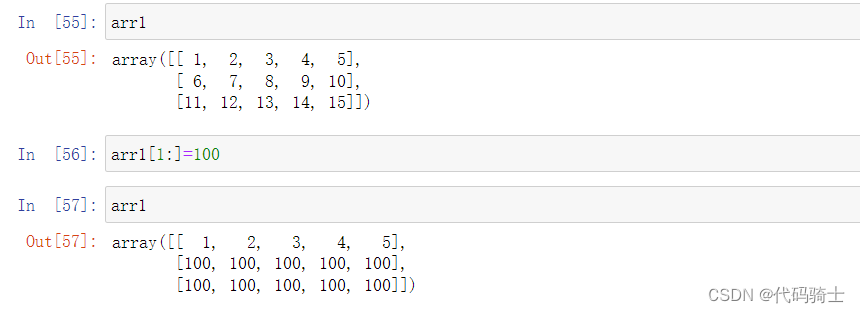
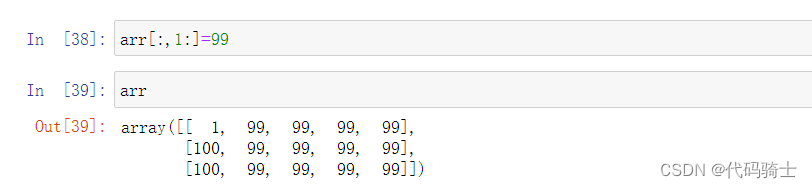
矩阵赋值
 逻辑判断
逻辑判断
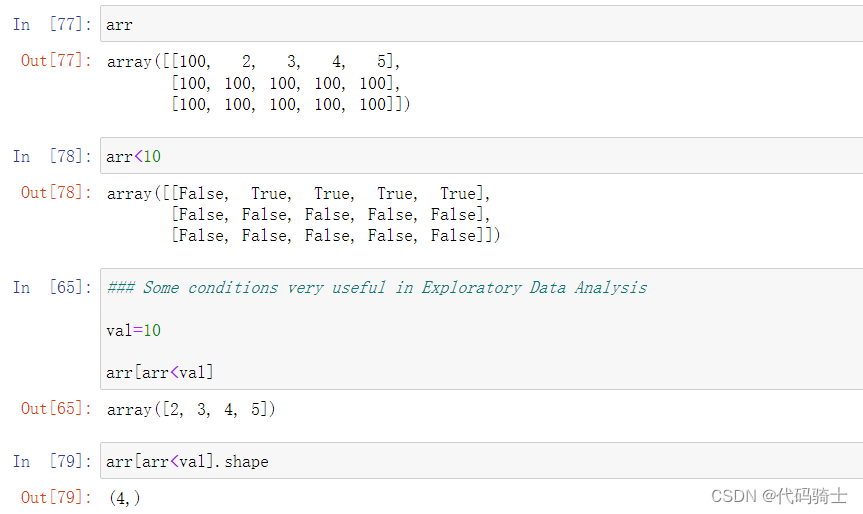
numpy.arrange函数
numpy.arrange函数的作用是生成带起点和终点的特定步长的排列。
Docstring:
arange([start,] stop[, step,], dtype=None, *, like=None)

Return evenly spaced values within a given interval.
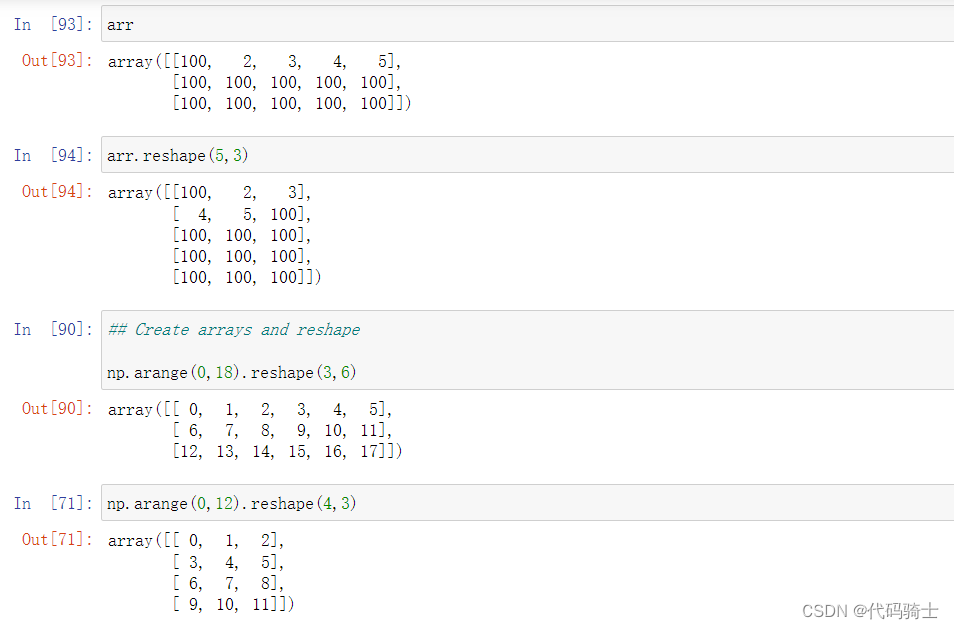
numpy.reshape函数
reshape(a,b)调整矩阵的行列个数排列为a行b列。但需要注意的是:原矩阵的size必须等于a*b。
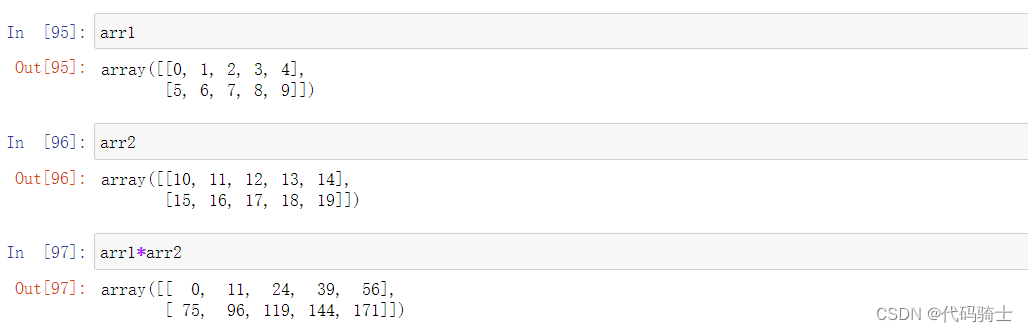
 矩阵对应元素相乘
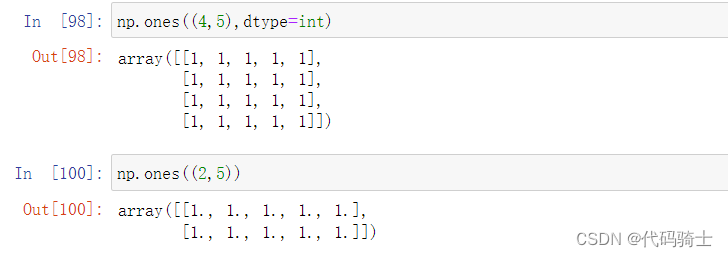
ones函数-全“1”矩阵
Signature: np.ones(shape, dtype=None, order='C', *, like=None)
Docstring:
Return a new array of given shape and type, filled with ones.
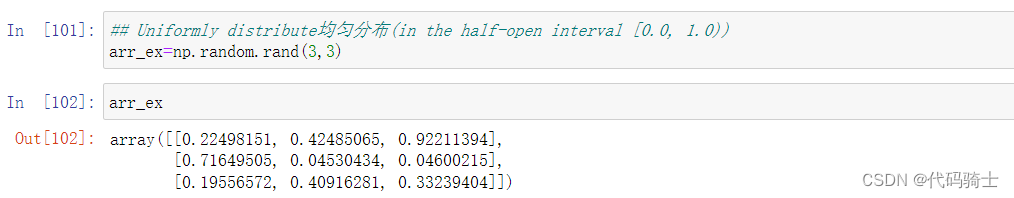
rand函数-随机均匀分布矩阵
Docstring:
rand(d0, d1, ..., dn)

Random values in a given shape.
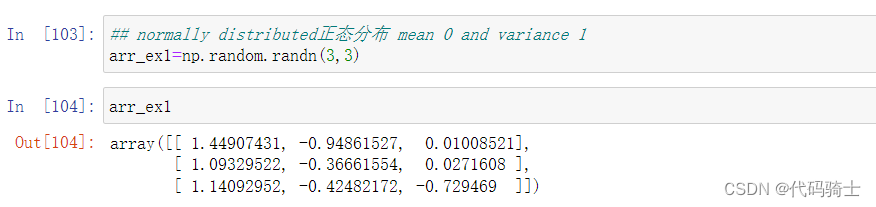
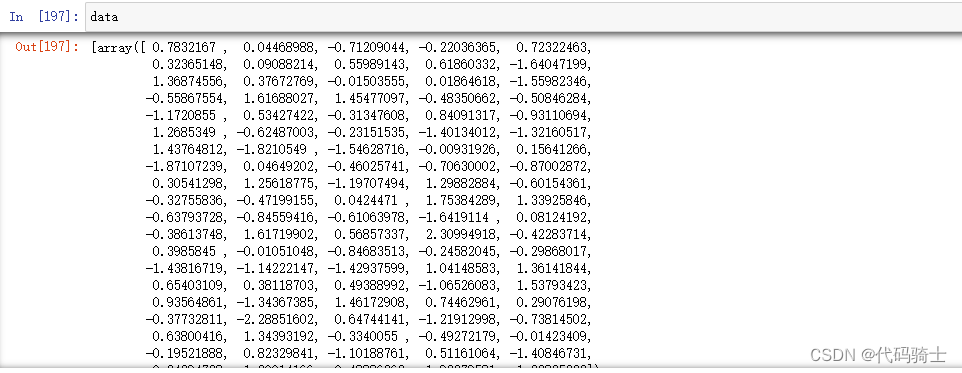
randn函数-随机正态分布矩阵
randn(d0, d1, ..., dn)

Return a sample (or samples) from the "standard normal" distribution.
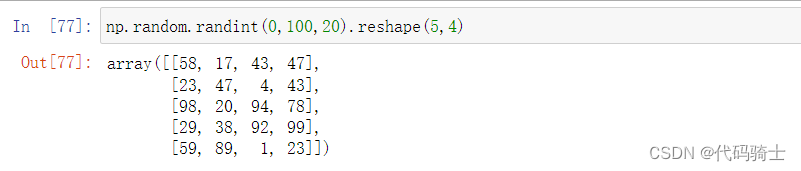
randint函数-随机生成整数矩阵
Docstring:
randint(low, high=None, size=None, dtype=int)

Return random integers from `low` (inclusive) to `high` (exclusive).
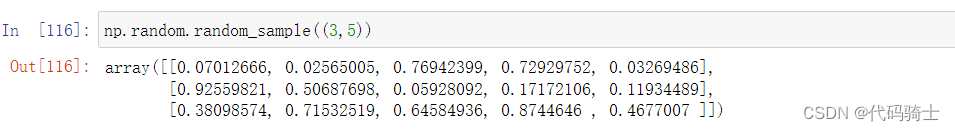
random_sample函数-随机生成浮点数矩阵
Docstring:
random_sample(size=None)

Return random floats in the half-open interval [0.0, 1.0).
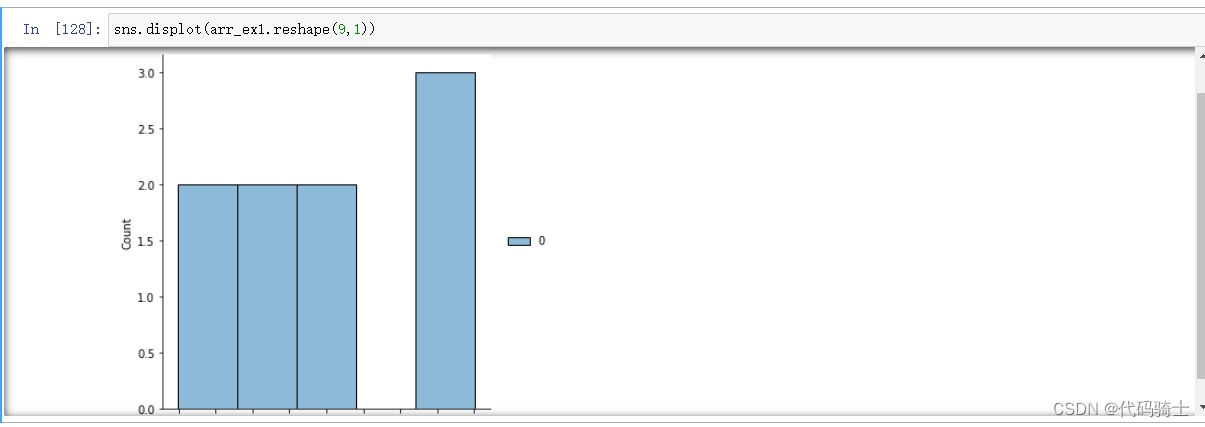
seaborn绘图库的使用
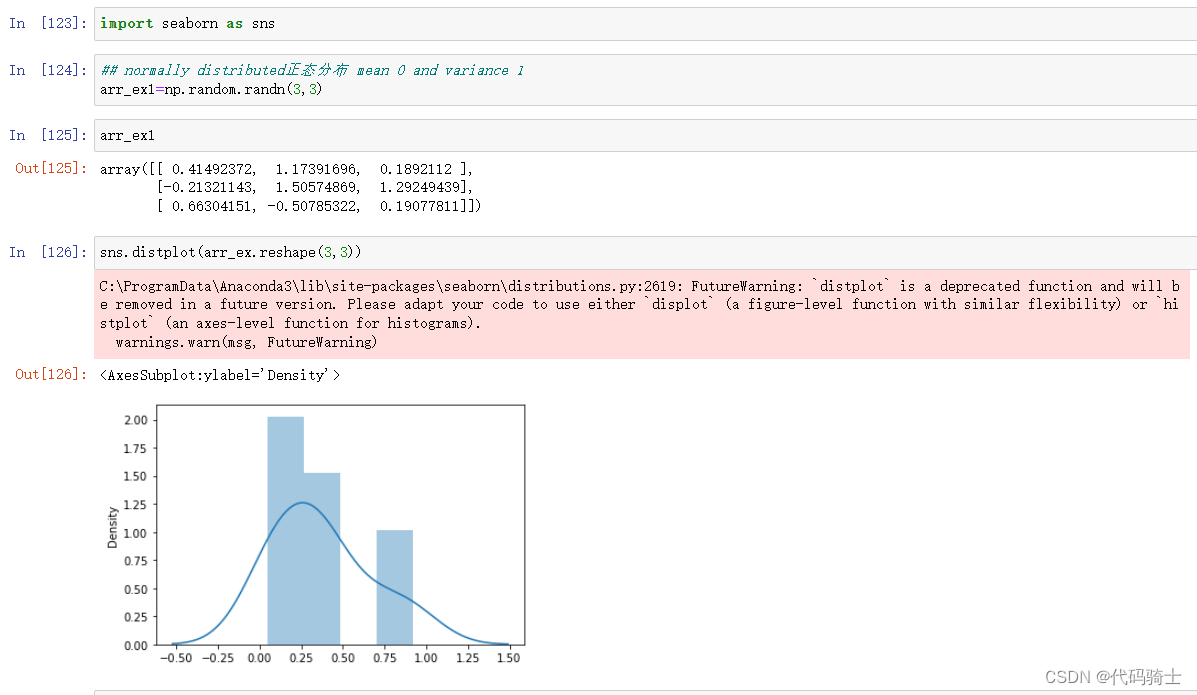
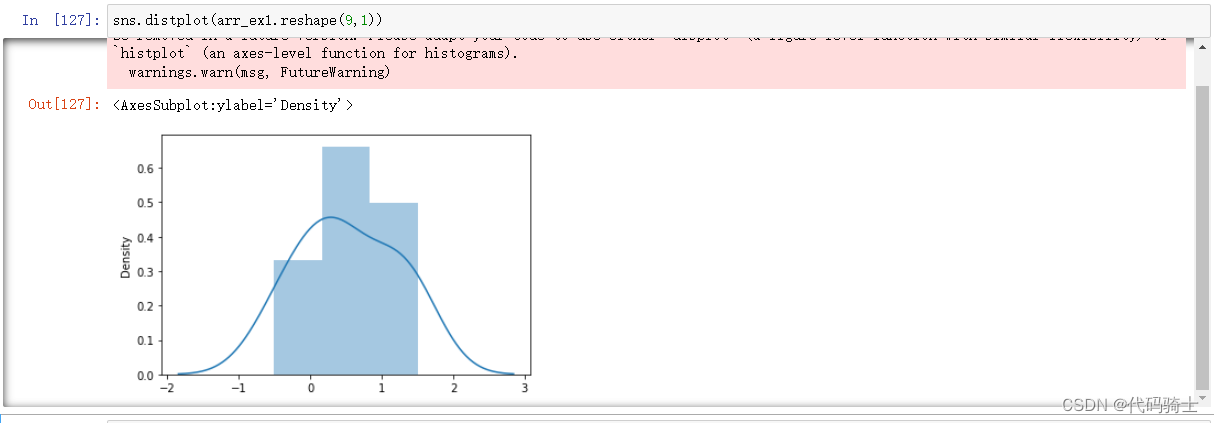 使用时发生了错误警告:
FutureWarning: `distplot` is a deprecated function and will be removed in a future version. Please adapt your code to use either `displot` (a figure-level function with similar flexibility) or `histplot` (an axes-level function for histograms).
warnings.warn(msg, FutureWarning)
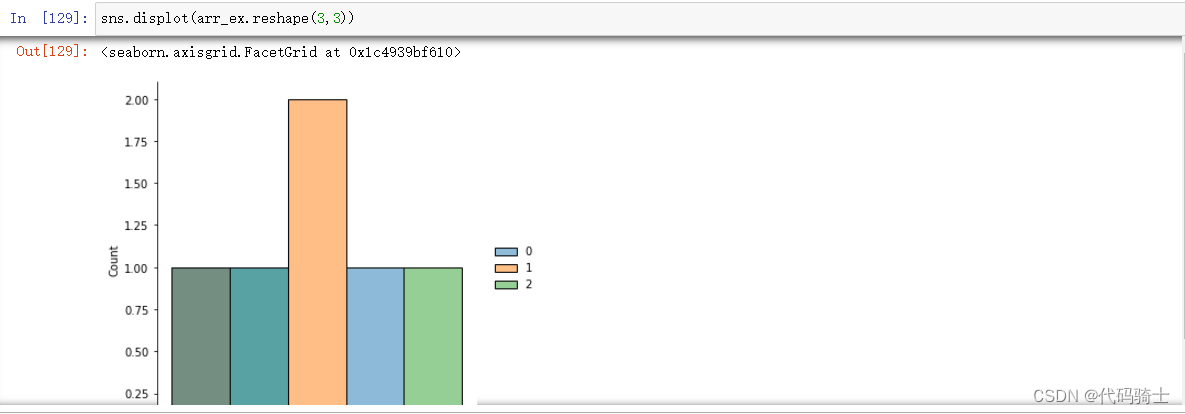
此错误的意思是
FutureWarning:distplot是已弃用的函数,将在以后的版本中删除。 请修改您的代码以使用“ displot”(具有类似灵活性的图形级函数)或“ histplot”(直方图的轴级函数)。
将distplot 改为displot ,错误解决,但是图形有所变化。
P4-Pandas csv,json,html,excel,pickle
pip install pandas
Pandas (Python Data Analysis Library) is an open source, BSD-licensed library providing high-performance, easy-to-use data structures and data analysis tools for the Python programming language.
pandas 是基于NumPy的一种工具,该工具是为了解决数据分析任务而创建的。Pandas 纳入了大量库和一些标准的数据模型,提供了高效地操作大型数据集所需的工具.
- Data Frames 是表格型的数据结构
- Data Series
- Different operation in Pandas
启动anaconda prompt在窗口中下载安装 pandas库:pip install pandas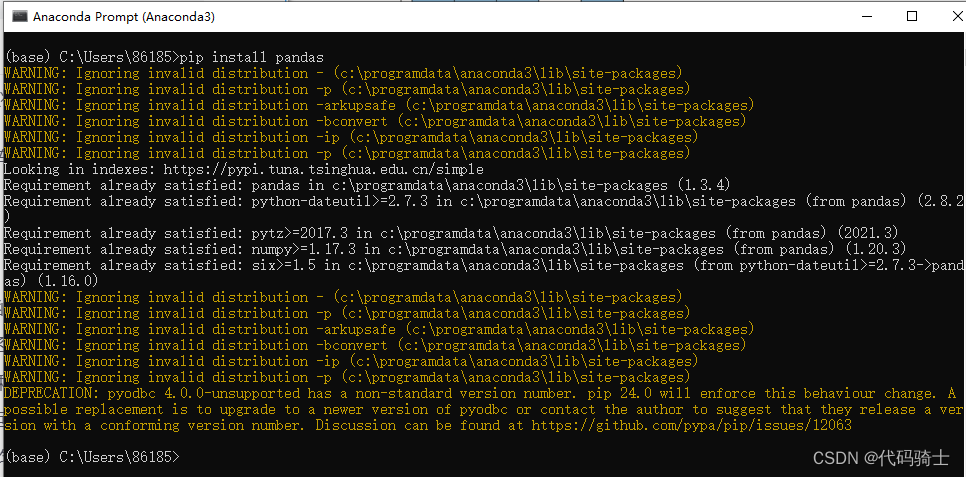
(1)DataFrames表格型的数据结构
矩阵转化为DataFrame
给表格加上行列的索引名
 参考代码:
参考代码:
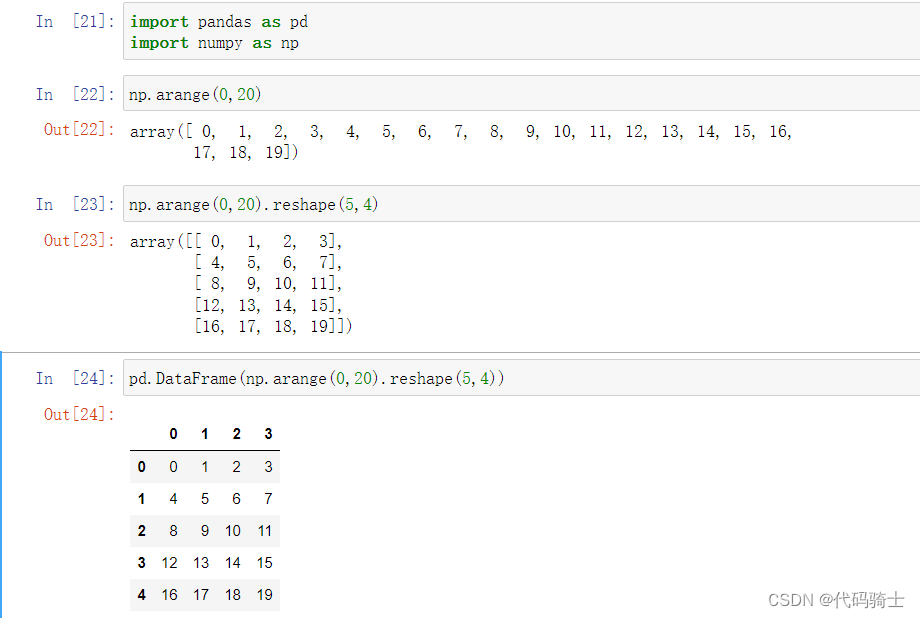
#库引用
import pandas as pd
import numpy as np
#将二维矩阵转化成DF表格
pd.DataFrame(np.arange(0,20).reshape(5,4))
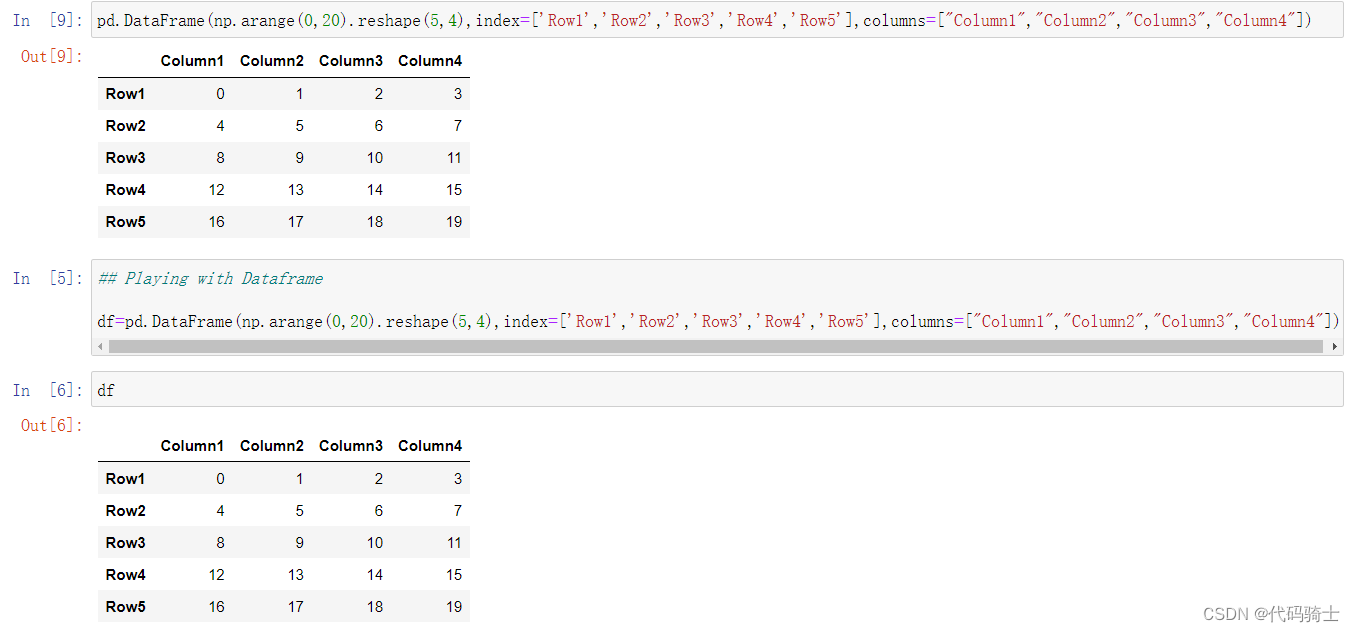
# 给行列加上索引名称
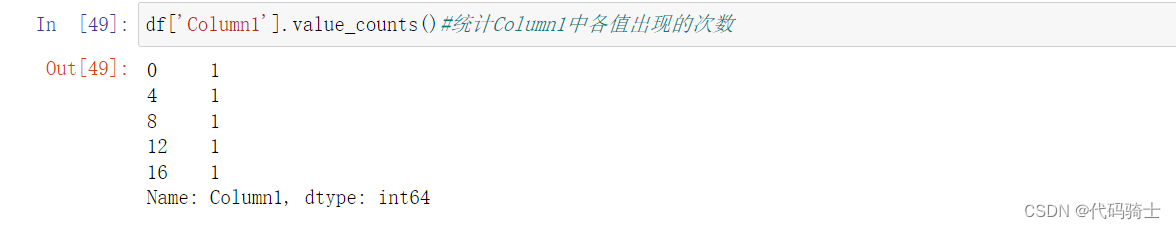
pd.DataFrame(np.arange(0,20).reshape(5,4),index=['Row1','Row2','Row3','Row4','Row5'],columns=["Column1","Column2","Column3","Column4"])
#创建df对象承载df表
## Playing with Dataframe
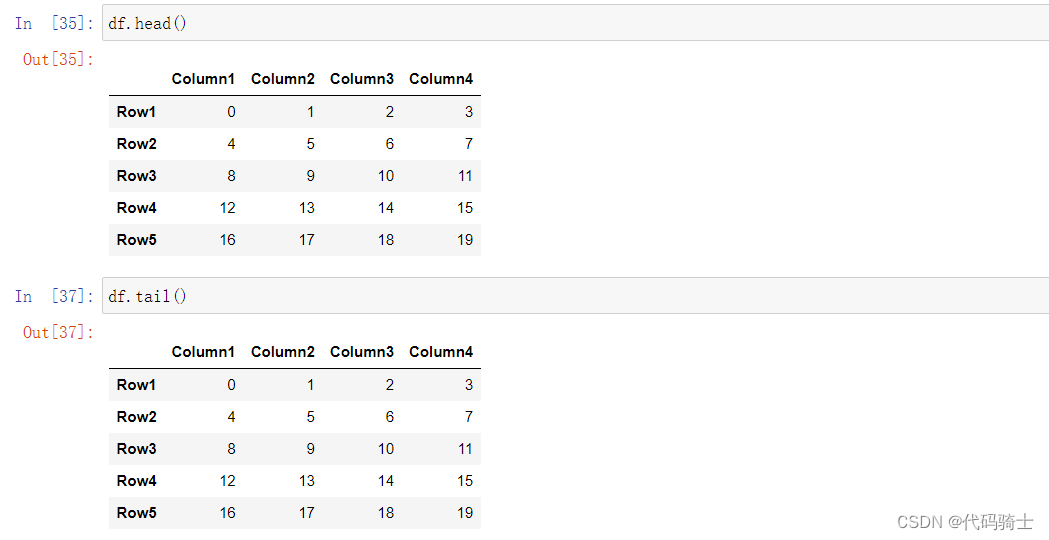
df=pd.DataFrame(np.arange(0,20).reshape(5,4),index=['Row1','Row2','Row3','Row4','Row5'],columns=["Column1","Column2","Column3","Column4"])Head函数和Tail函数
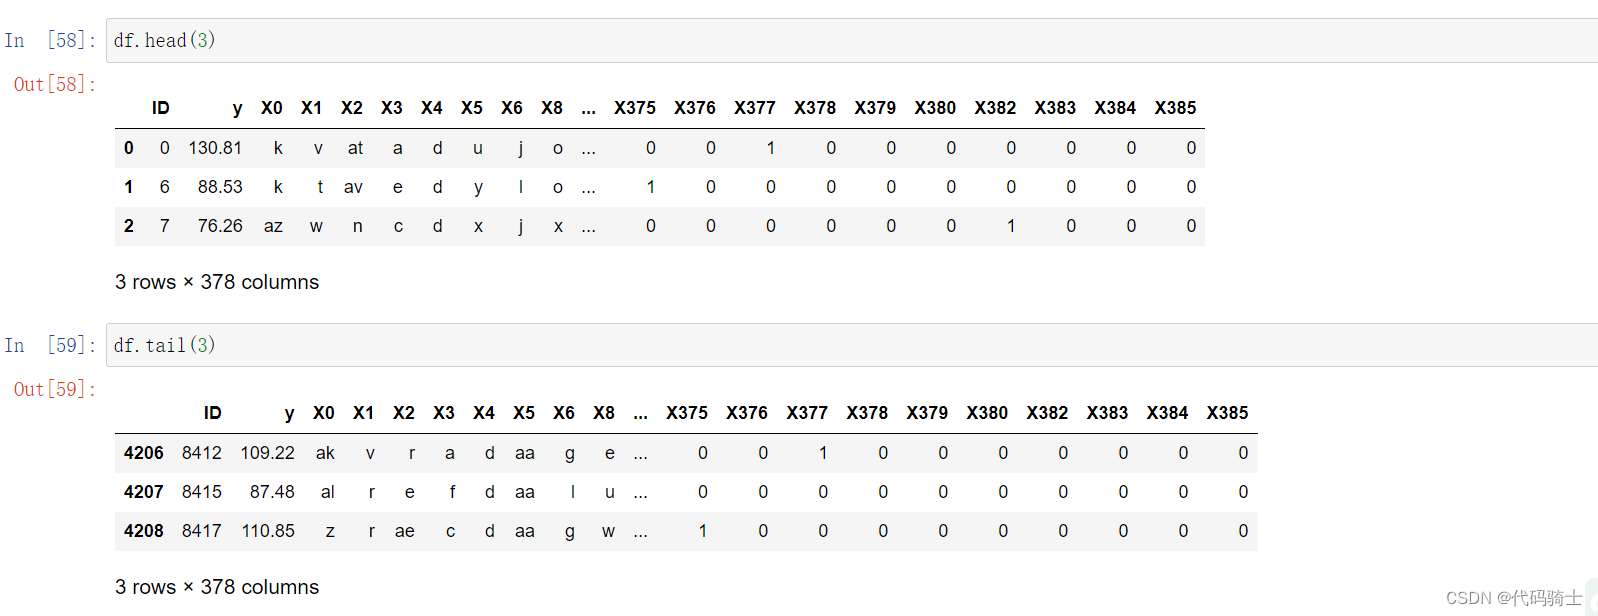
- head(int n)——显示表中的前n条信息,默认n=5
-
Signature: df.head(n: 'int' = 5) -> 'FrameOrSeries'
Docstring:
Return the first `n` rows.
- tail(int n)——显示表中的后n条信息,默认n=5
-
Signature: df.tail(n: 'int' = 5) -> 'FrameOrSeries'
Docstring:
Return the last `n` rows.
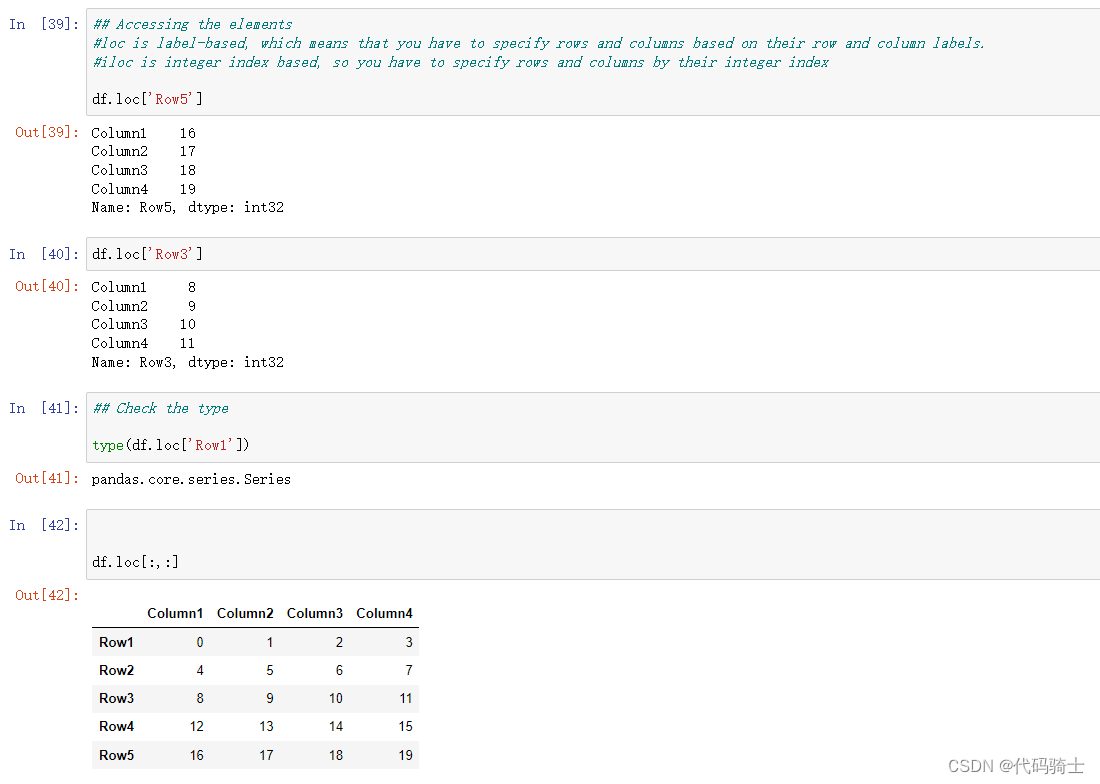
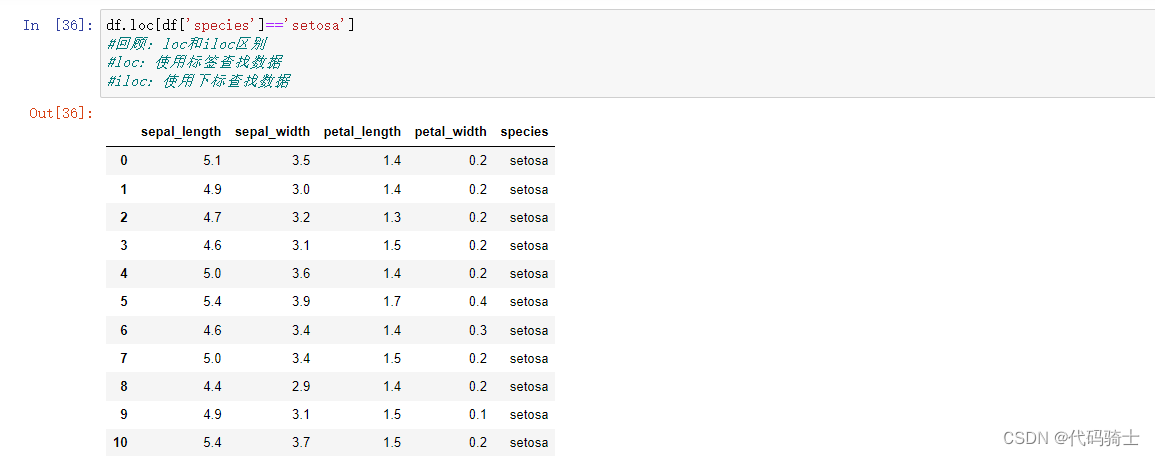
Using loc or iloc to access the elements
#loc 是基于标签的,这意味着您必须根据行和列标签来指定行和列。
#iloc 是基于整数索引的,因此您必须通过整数索引指定行和列
loc取数
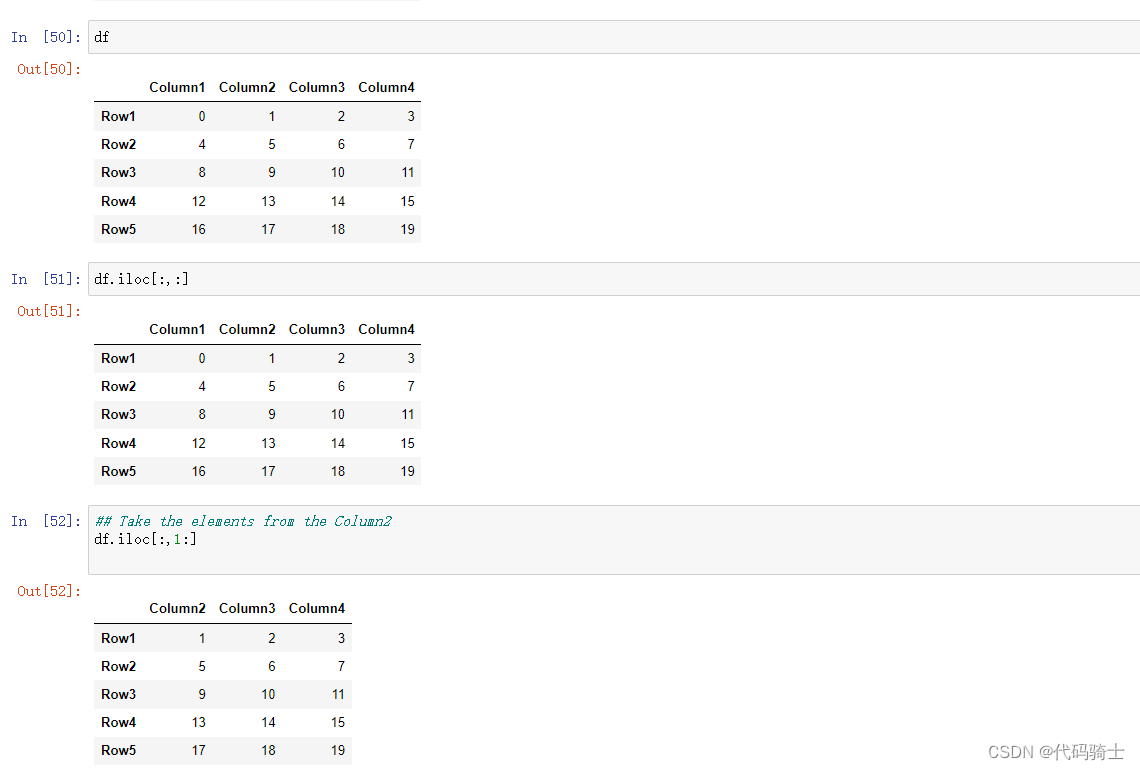
iloc取数
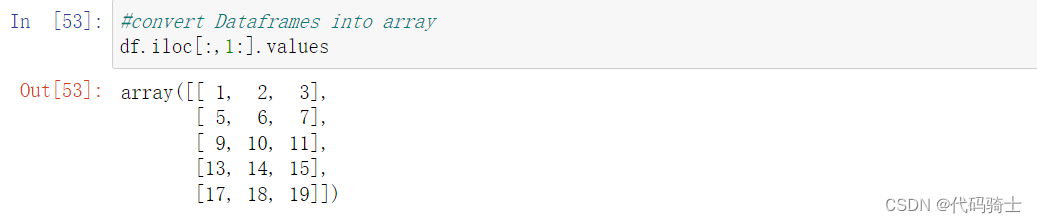
convert Dataframes into array
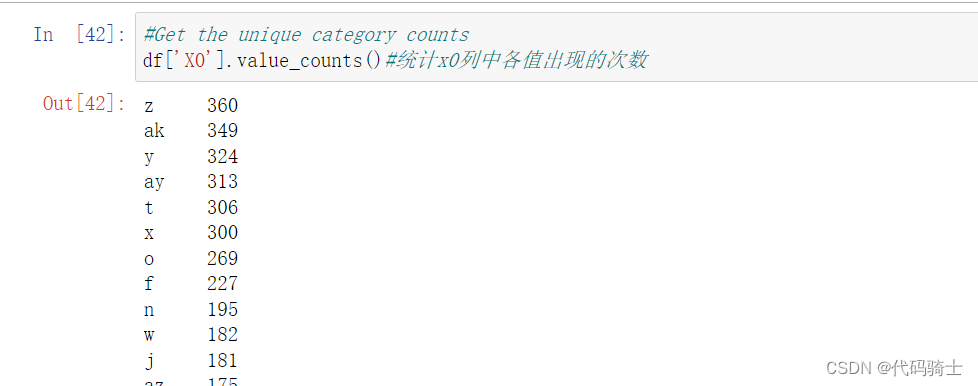
统计Column1中各值出现的次数
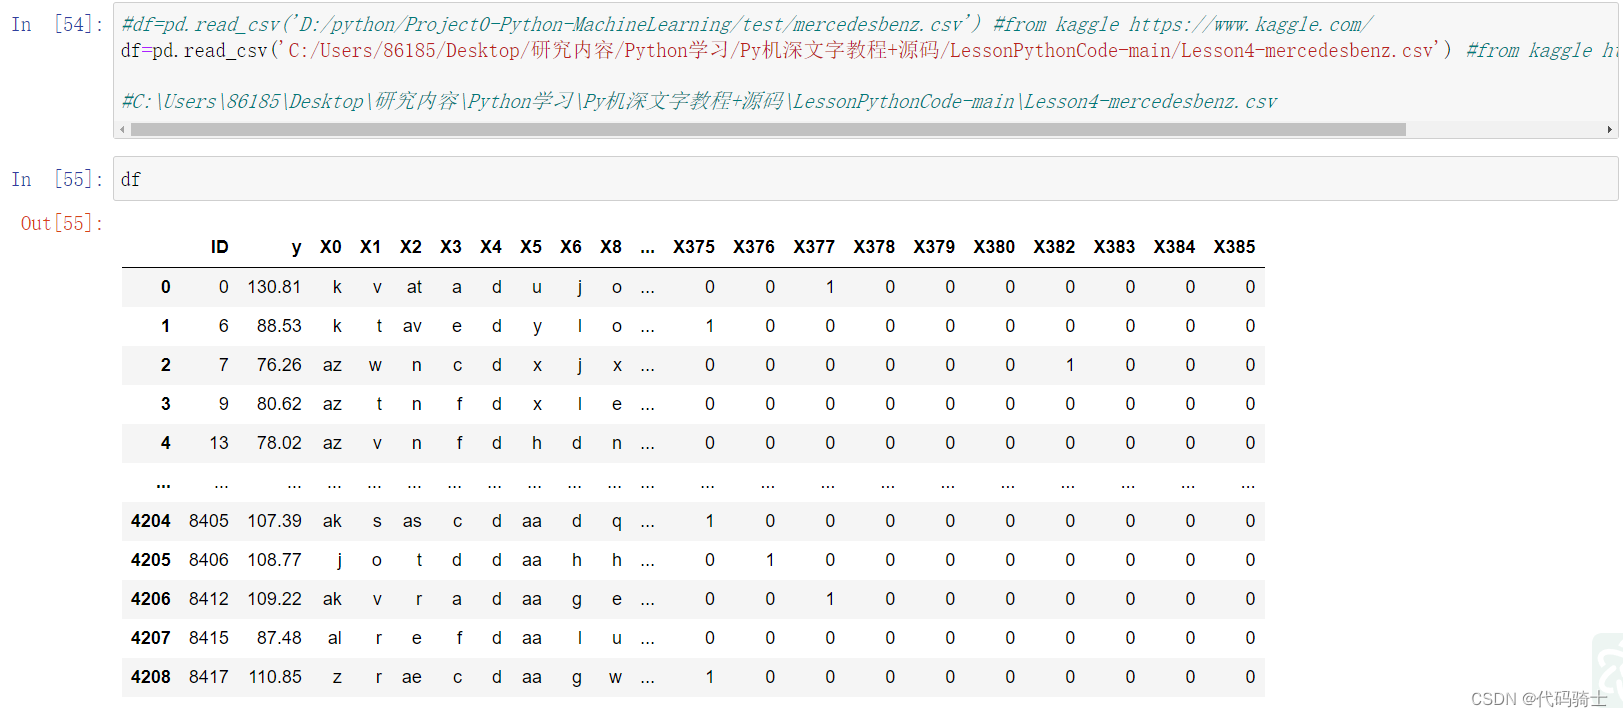
pd通过本地csv文件获取数据
 Head与Tail函数
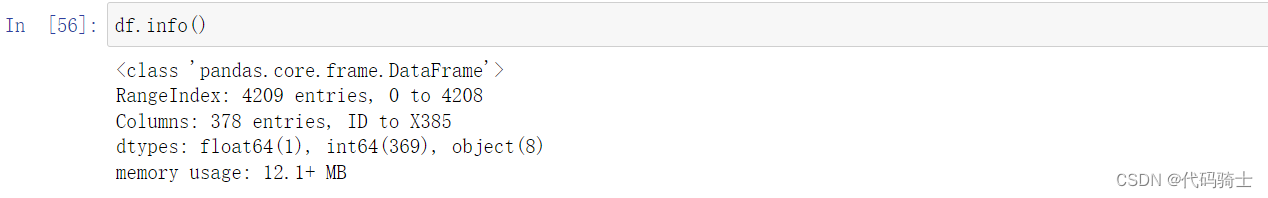
Info函数显示数据表基本信息
Signature:
df.info(
    verbose: 'bool | None' = None,
    buf: 'IO[str] | None' = None,
    max_cols: 'int | None' = None,
    memory_usage: 'bool | str | None' = None,
    show_counts: 'bool | None' = None,
    null_counts: 'bool | None' = None,
) -> 'None'
Docstring:
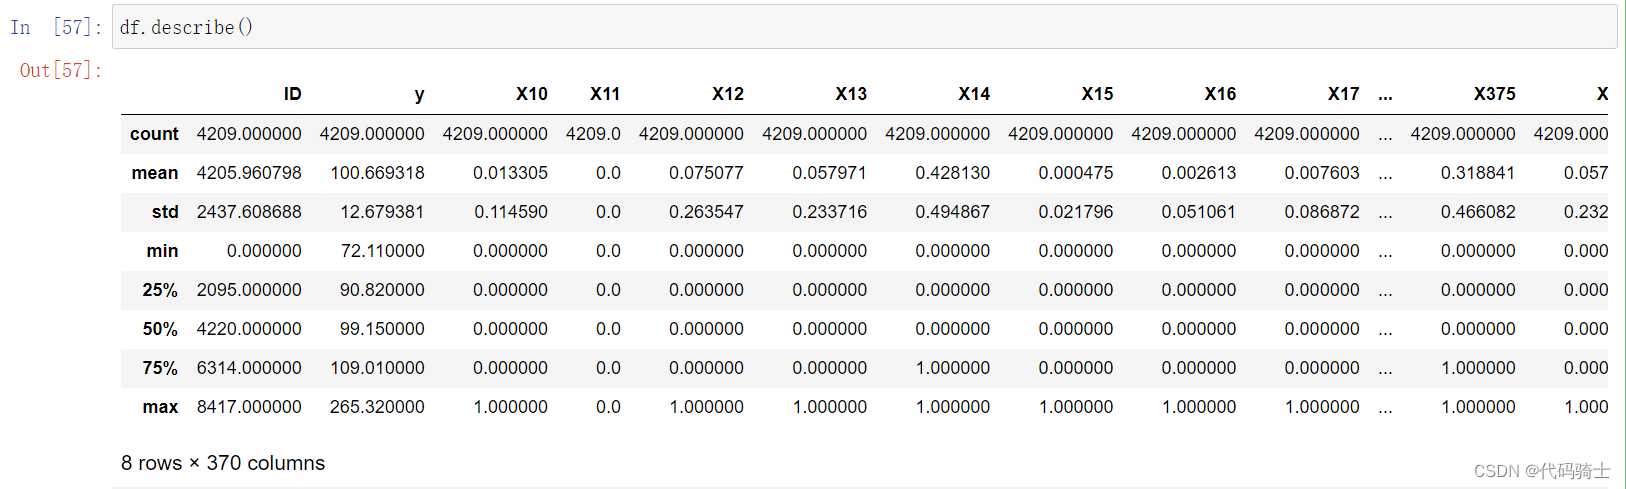
describe函数描述数据表基本信息
Signature:
df.describe(
    percentiles=None,
    include=None,
    exclude=None,
    datetime_is_numeric=False,
) -> 'FrameOrSeries'
Docstring:
Generate descriptive statistics.
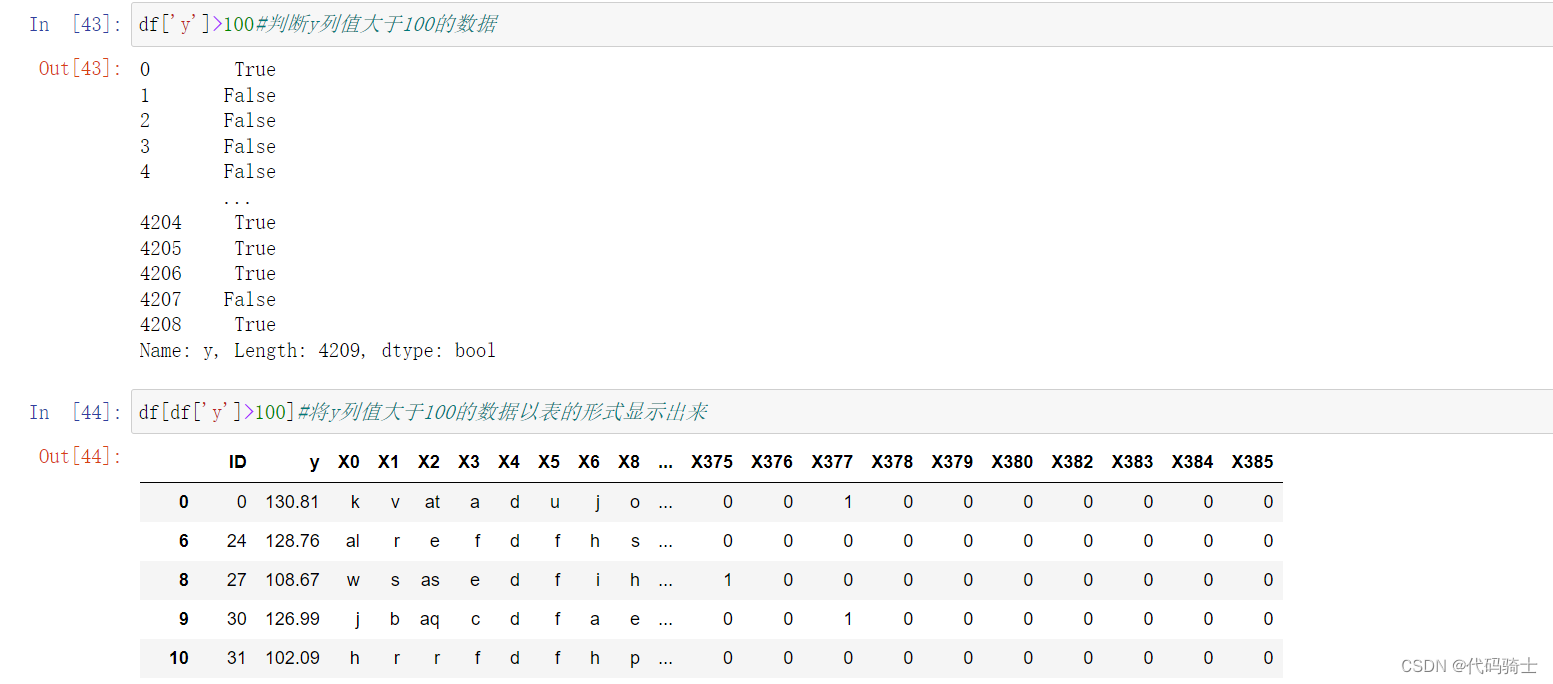
一些取值操作
(2)CSV
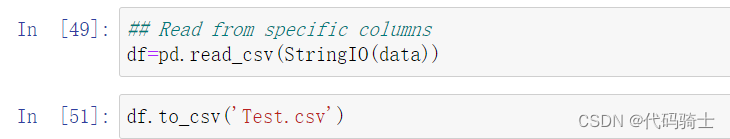
pd.read_csv(StringIO(str))函数以csv模式读字符串
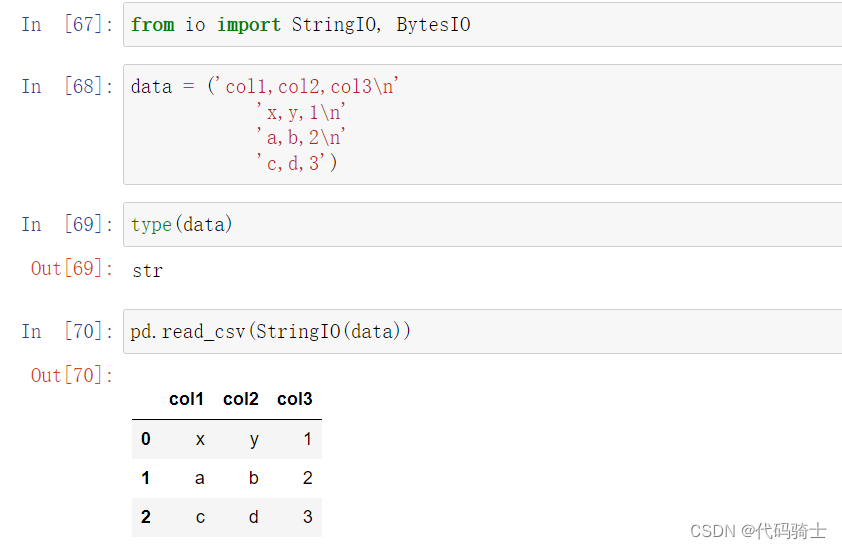
pd.read_csv(StringIO(data))函数将字符串保存到csv表格类型
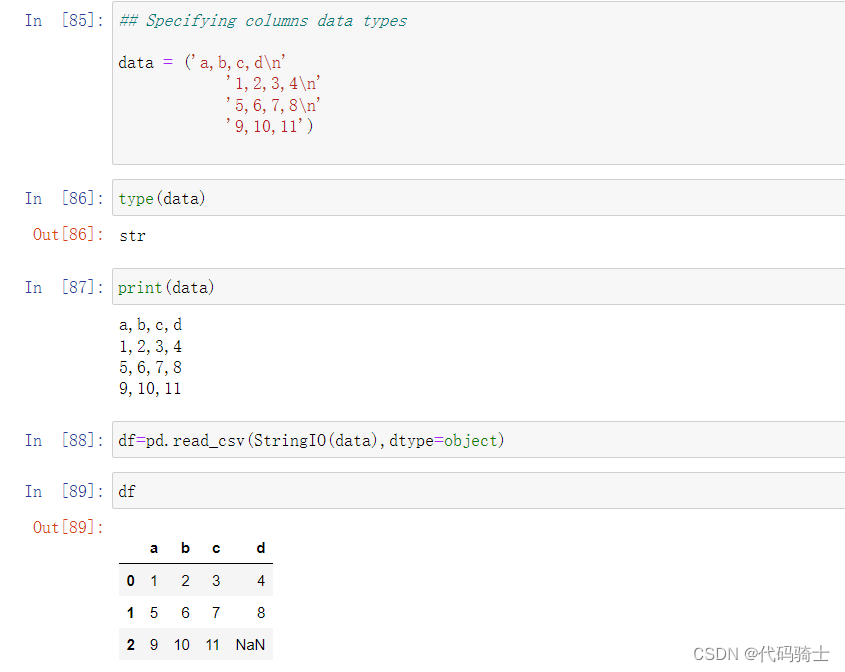
设置表格索引列数据的数据类型(将原本的str转换成所需要的类型)
df=pd.read_csv(StringIO(data),dtype=object)
df=pd.read_csv(StringIO(data),dtype={'b':int,'c':float,'a':'Int64'})#a,b,c是索引列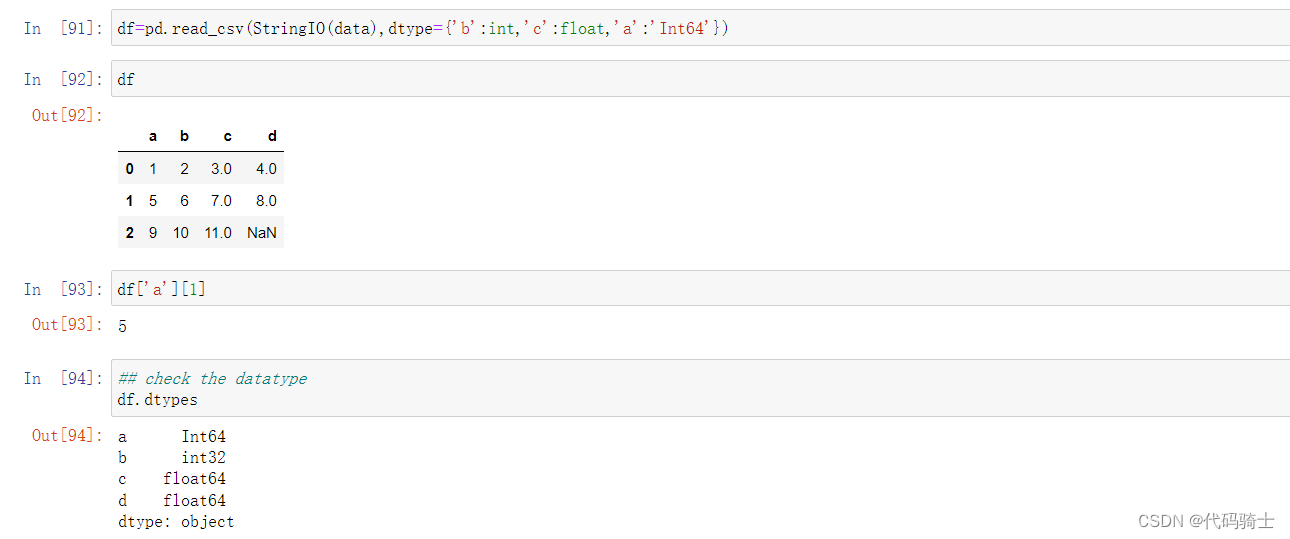
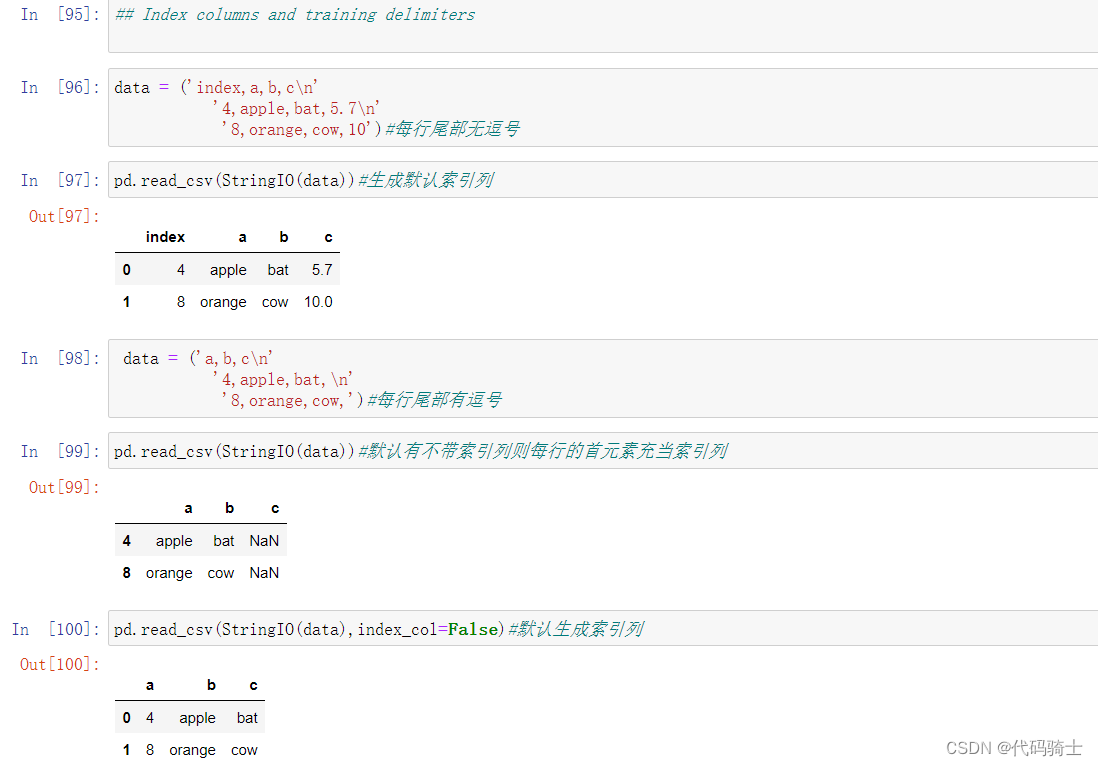
索引列和分隔符
index_col参数——False默认生成索引列。True(默认值)每行首元素为索引列。
usecols参数——指定显示某列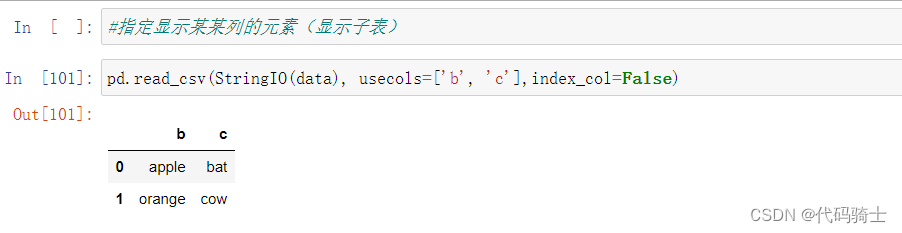
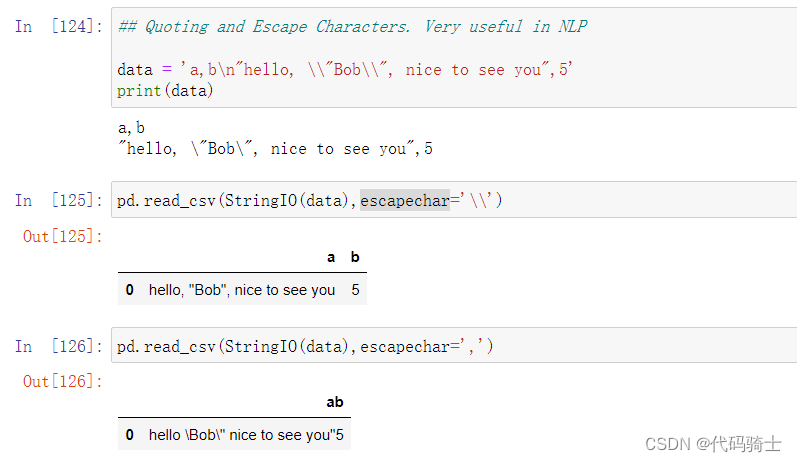
引用和转义字符(在 NLP 中非常有用)
escapechar参数-避免某些字符
URL to CSV

Read Json to CSV

convert Json to csv

convert Json to different json formats


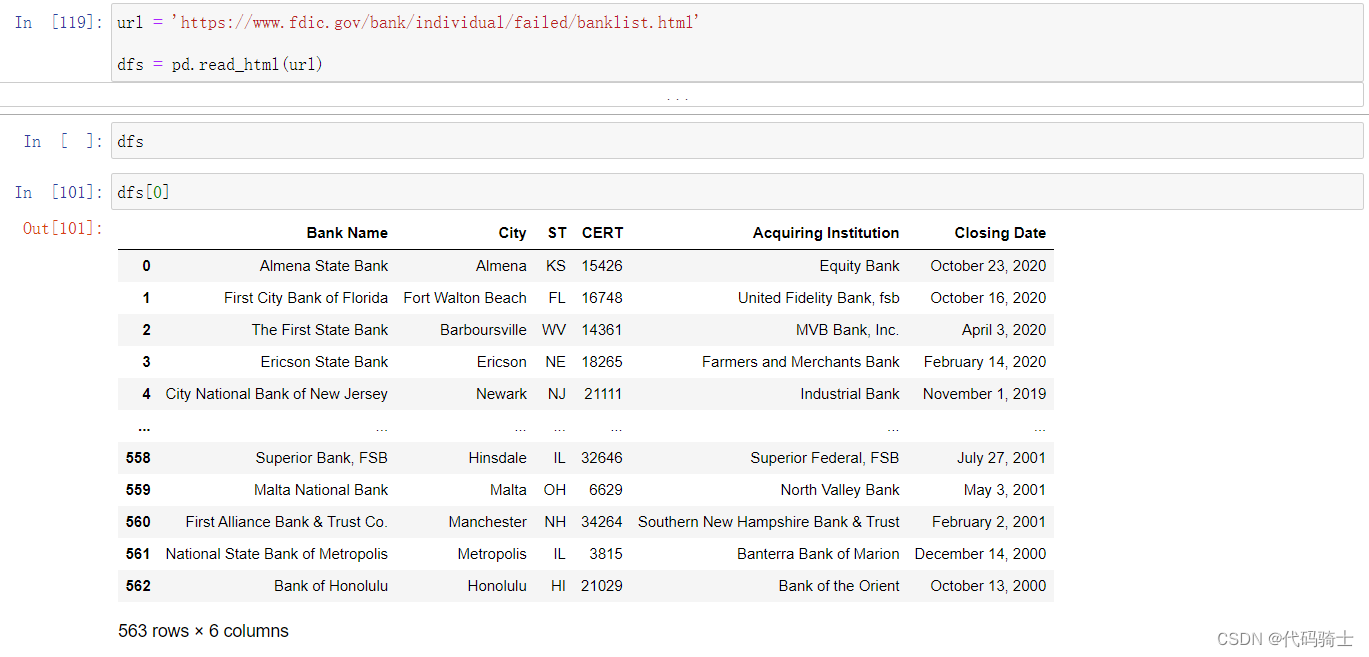
(3)Pandas Reading HTML content
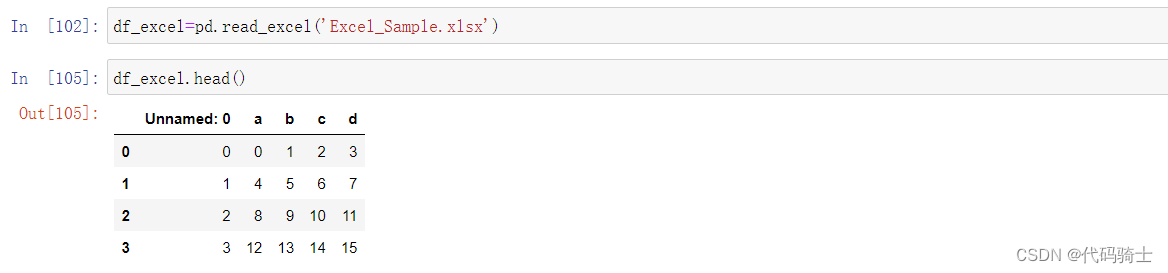
(4)Pandas Reading Excel Files
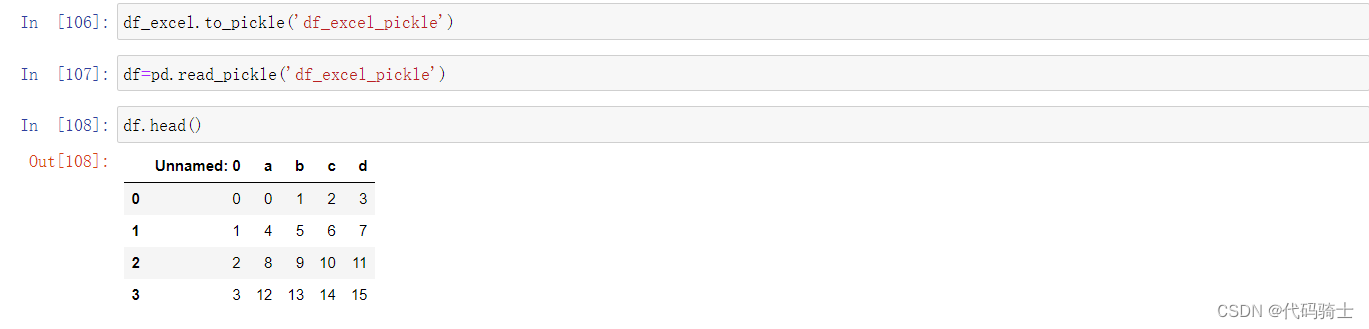
(5)Pickling
python特有的一种数据文件格式。
All pandas objects are equipped with to_pickle methods which use Python’s Pickle module to save data structures to disk using the pickle format.
所有 pandas 对象都配备了 to_pickle 方法,该方法使用 Python 的 Pickle 模块以 pickle 格式将数据结构保存到磁盘。
数据集网站kaggle Kaggle: Your Machine Learning and Data Science Community
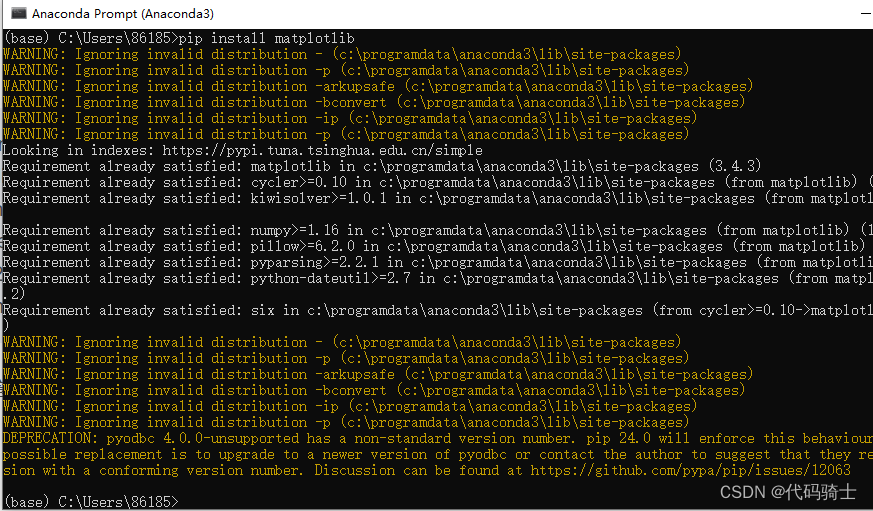
P5-MatplotLib
Command line:conda install -c conda-forge matplotlib 或者 pip install matplotlib
Matplotlib is a plotting library for the Python programming language and its numerical mathematics extension NumPy. It provides an object-oriented API for embedding plots into applications using general-purpose GUI toolkits like Tkinter, wxPython, Qt, or GTK+.
Matplotlib 是Python的2D绘图库
%matplotlib inline will make your plot outputs appear and be stored within the notebook
启动anaconda prompt在窗口中下载安装 matplotlib 库:conda install -c conda-forge matplotlib或者pip install matplotlib
绘制与保存图片
导入头文件和配置中文显示
import matplotlib.pyplot as plt

plt.rcParams['font.sans-serif']=['SimHei'] #用来正常显示中文标签
plt.rcParams['axes.unicode_minus']=False #用来正常显示负号
#%matplotlib inline便于在Jupyter环境下显示图像(省略plt.show())
%matplotlib inline
生成数据
import numpy as np

## Simple Examples

x=np.arange(0,10)
y=np.arange(11,21)
绘制散点图
plt.scatter(x,y,c='g')#散点图,c表示颜色r,g,b
plt.show()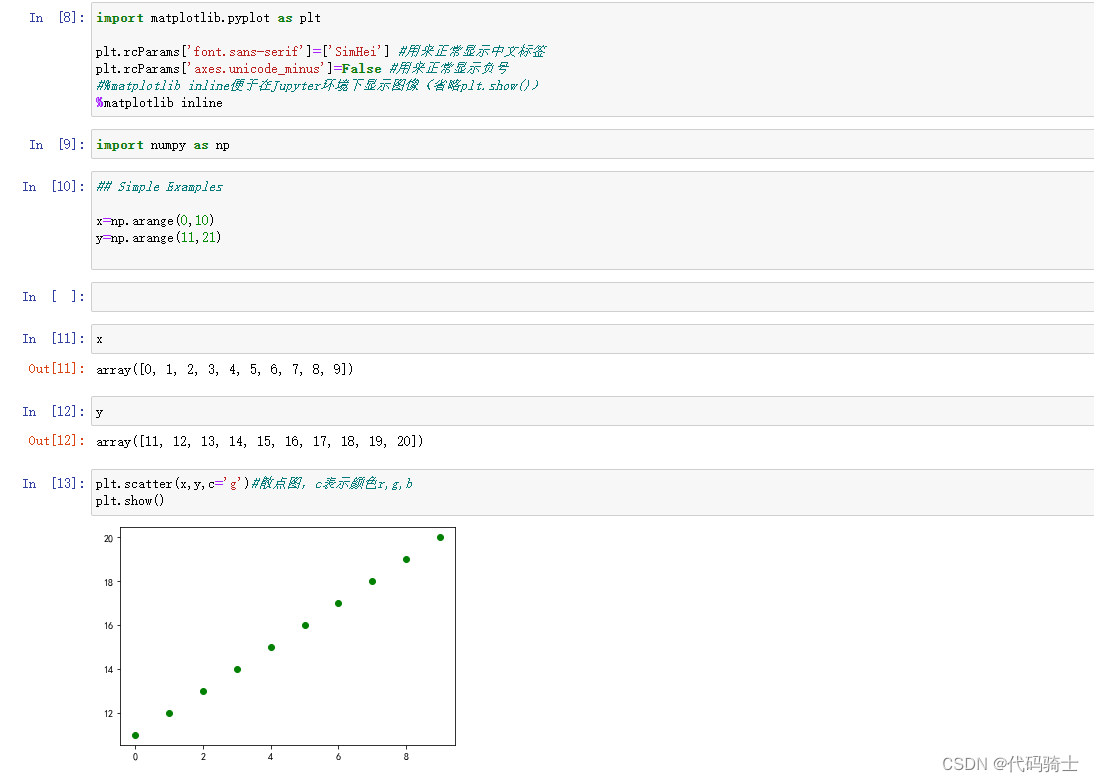
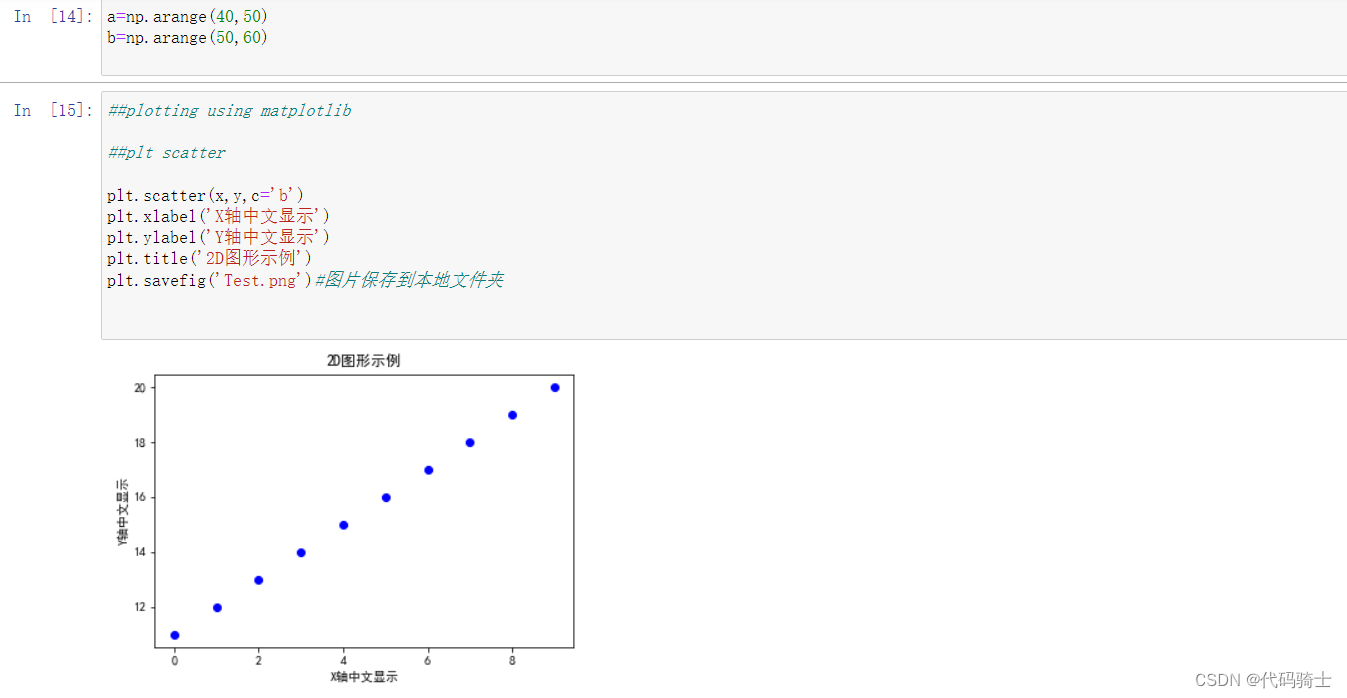
配置标签保存图片到本地
##plotting using matplotlib

##plt scatter

plt.scatter(x,y,c='b')
plt.xlabel('X轴中文显示')
plt.ylabel('Y轴中文显示')
plt.title('2D图形示例')
plt.savefig('Test.png')#图片保存到本地文件夹
绘制简单函数图像
y=x*x## plt plot
plt.plot(x,y,'bo',linestyle='dashed',linewidth=1,markersize=15)#第三个参数表示散点的颜色和形状,rgb是颜色,xo*等是点的形状。linestyle:solid是实线
plt.xlabel('X axis')
plt.ylabel('Y axis')
plt.title('2d Diagram')
plt.savefig('Test.png')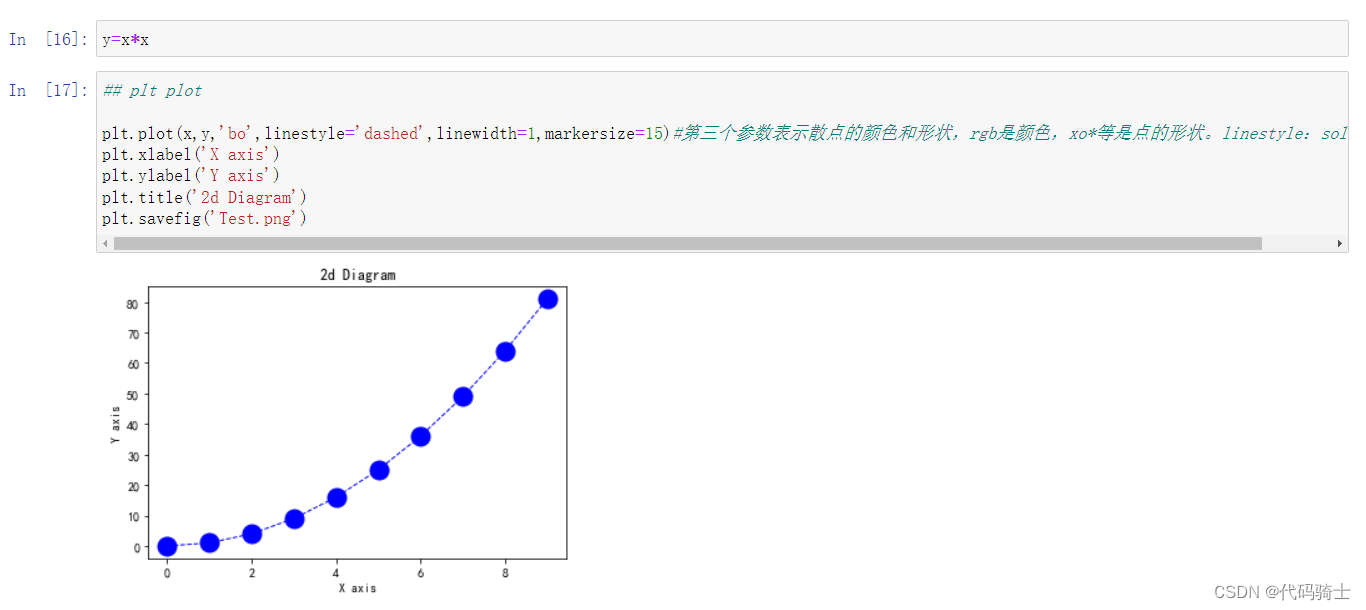
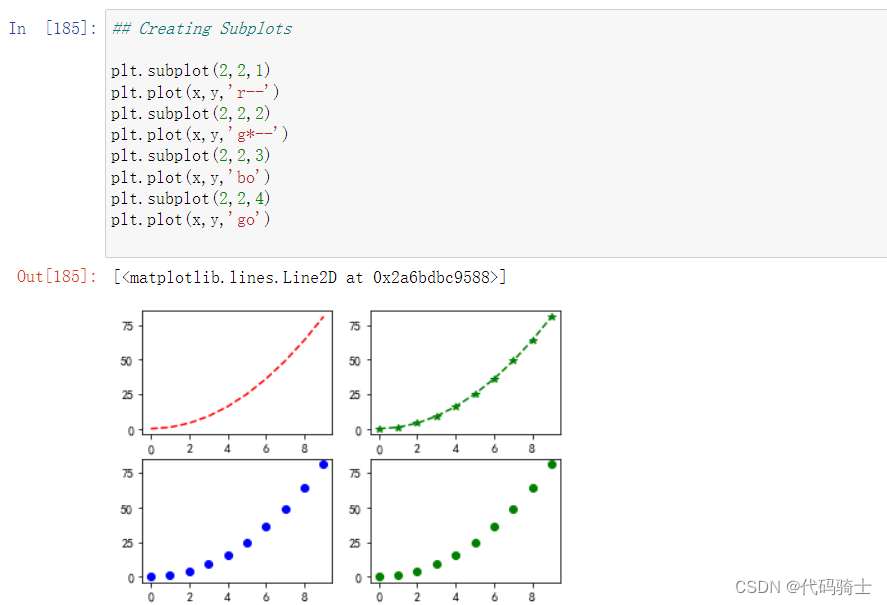
分割子图
## Creating Subplots

plt.subplot(2,2,1)
plt.plot(x,y,'r--')
plt.subplot(2,2,2)
plt.plot(x,y,'g*--')
plt.subplot(2,2,3)
plt.plot(x,y,'bo')
plt.subplot(2,2,4)
plt.plot(x,y,'go')
数学应用
x = np.arange(1,11)
y = 3 * x + 5 #y=ax+b
plt.title("Matplotlib demo")
plt.xlabel("x axis caption")
plt.ylabel("y axis caption")
plt.plot(x,y)
plt.show() 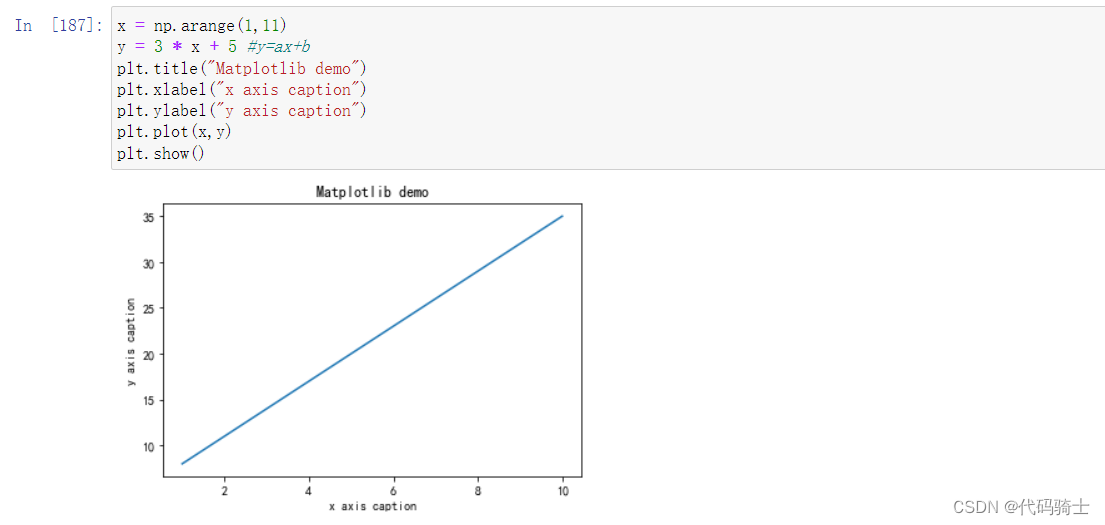
# Compute the x and y coordinates for points on a sine curve
x = np.arange(0, 4 * np.pi, 0.1)
y = np.sin(x)
plt.title("sine wave form")

# Plot the points using matplotlib
plt.plot(x, y)
plt.show() 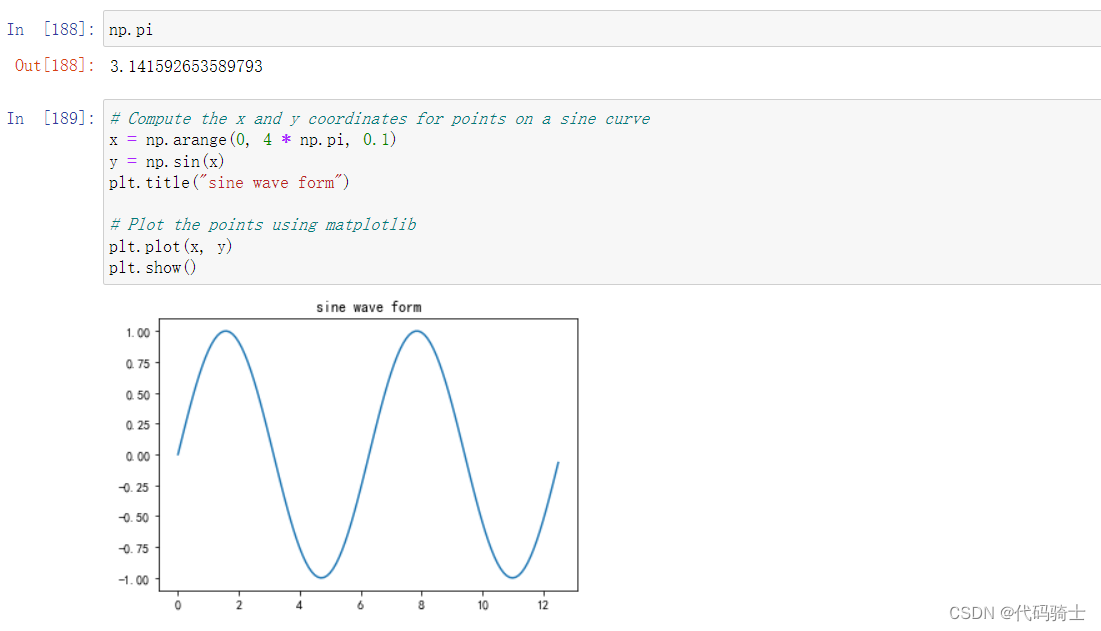
#Subplot()
# Compute the x and y coordinates for points on sine and cosine curves
x = np.arange(0, 5 * np.pi, 0.1)
y_sin = np.sin(x)
y_cos = np.cos(x)

# Set up a subplot grid that has height 2 and width 1,
# and set the first such subplot as active.
plt.subplot(2, 2, 1)

# Make the first plot
plt.plot(x, y_sin,'r--')
plt.title('Sine')

# Set the second subplot as active, and make the second plot.
plt.subplot(2, 2, 2)
plt.plot(x, y_cos,'g--')
plt.title('Cosine')

# Show the figure.
plt.show() 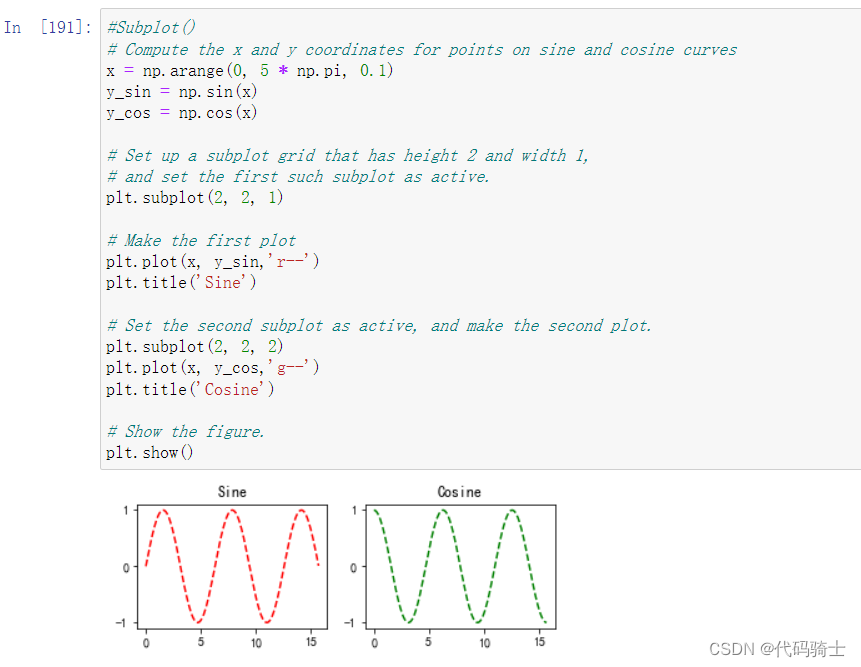
柱状图
## Bar plot

x = [2,8,10]
y = [11,16,9]

x2 = [3,9,11]
y2 = [6,15,7]
plt.bar(x, y)
plt.bar(x2, y2, color = 'g')
plt.title('Bar graph')
plt.ylabel('Y axis')
plt.xlabel('X axis')

plt.show()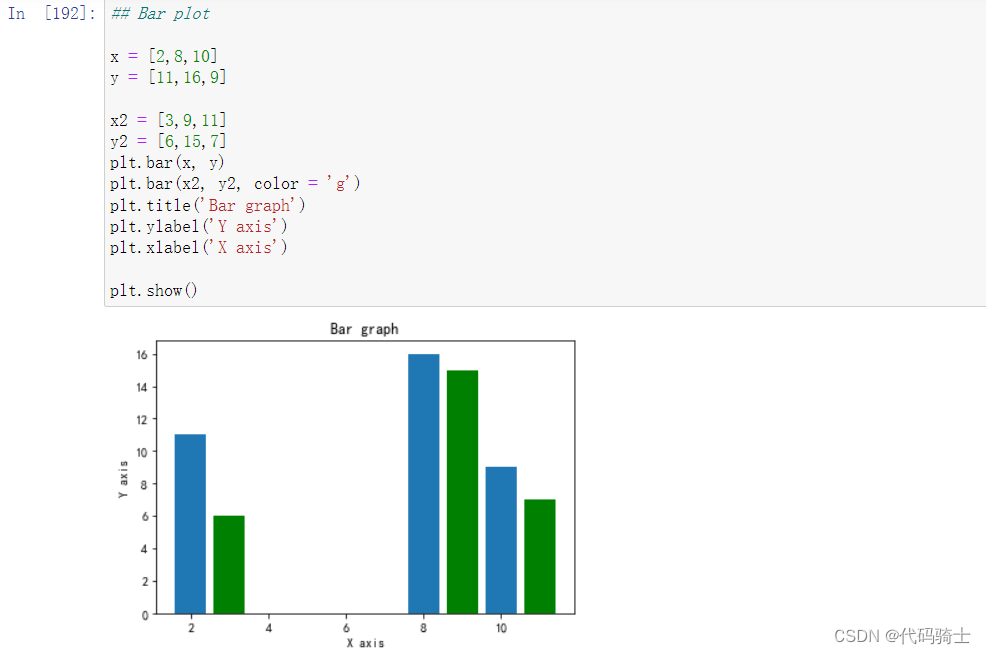
直方图
#Histograms
a = np.array([22,87,5,43,56,73,55,54,11,20,51,5,79,31,27])
plt.hist(a,bins=20)
plt.title("histogram")
plt.show()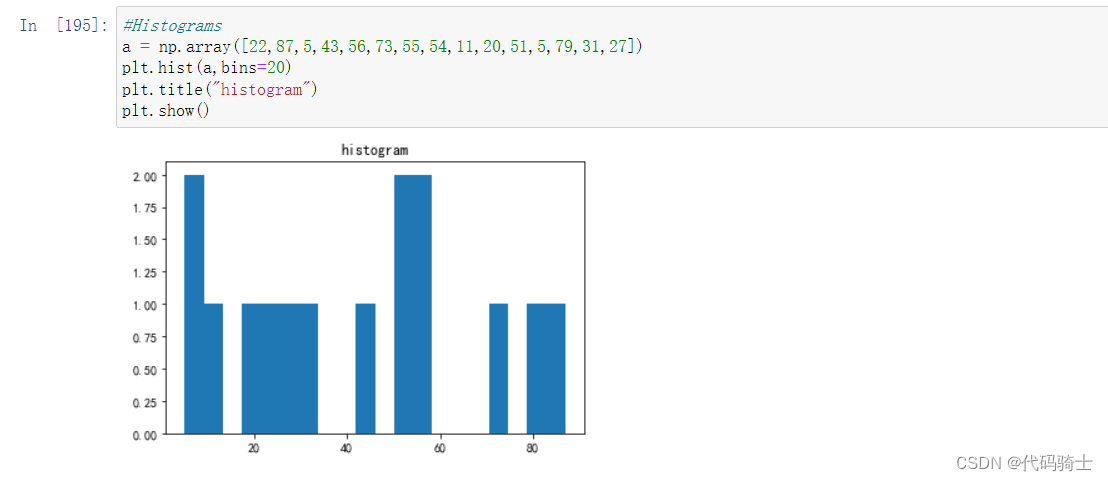
箱图
#Box Plot using Matplotlib
data = [np.random.normal(0, std, 100) for std in range(1, 4)]

# rectangular box plot
plt.boxplot(data,vert=True,patch_artist=False)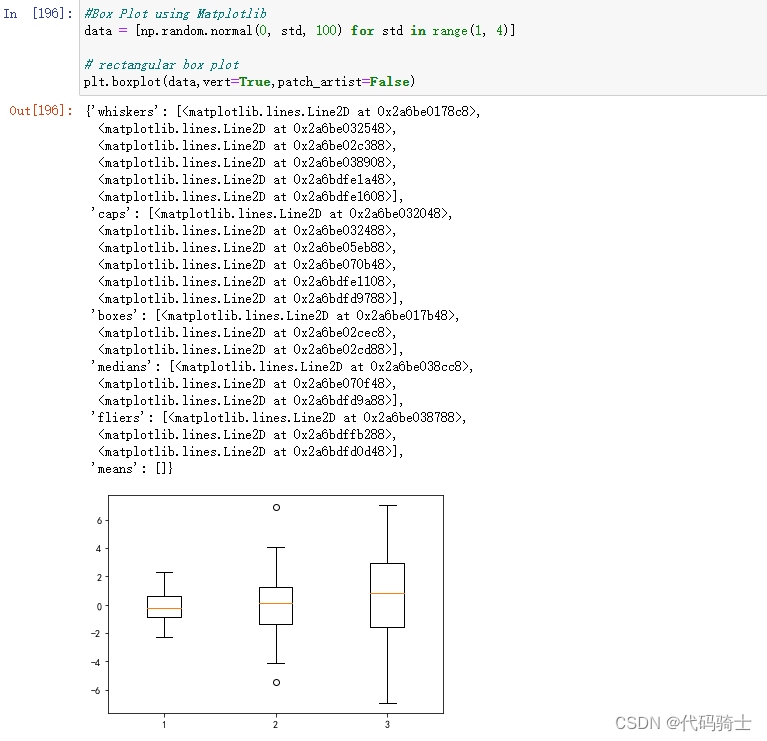
饼图
#pie chart

# Data to plot
labels = 'Python', 'C++', 'Ruby', 'Java'
sizes = [215, 160, 245, 210]
colors = ['gold', 'yellowgreen', 'lightcoral', 'lightskyblue']
explode = (0.2, 0.1, 0.1, 0)  # explode 1st slice

# Plot
plt.pie(sizes, explode=explode, labels=labels, colors=colors,
autopct='%1.2f%%', shadow=False)

plt.axis('equal')
plt.show()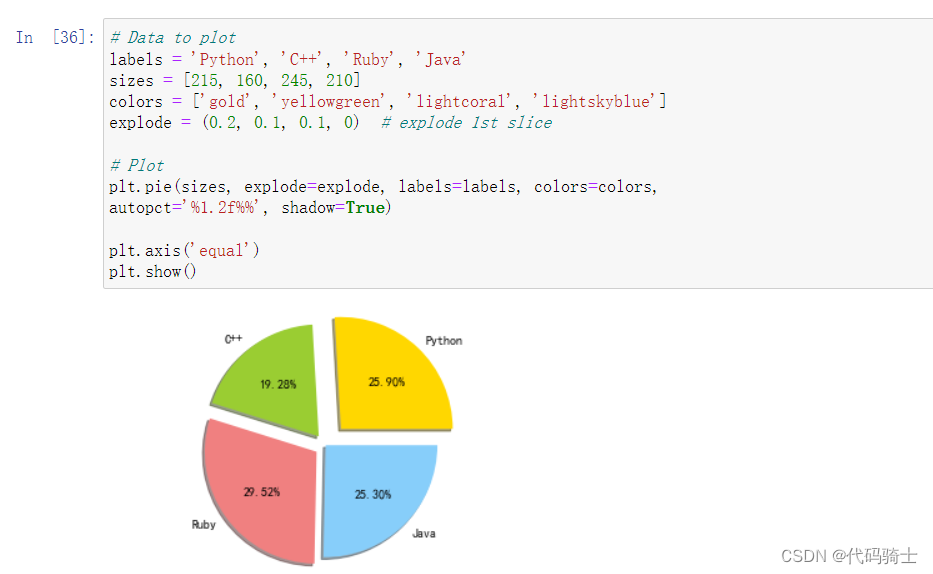
P6-Seaborn图形进行数据分析
获取seaborn自带数据集seaborn-data: seaborn-data 数据集
seaborn从入门到精通-seaborn在load_dataset(“tips“)出现超时的错误_sns.load_dataset()连接超时-CSDN博客
clone下来的数据集复制到项目目录 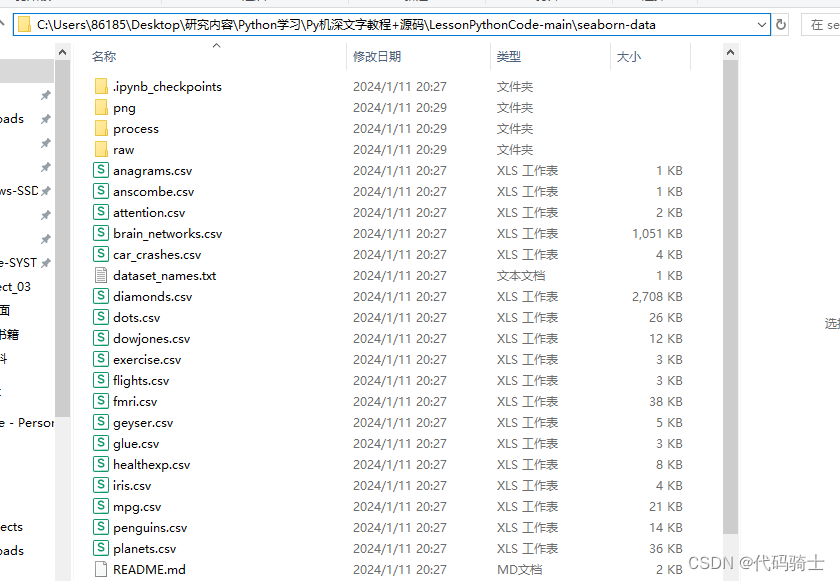
通过修改参数路径加载数据集
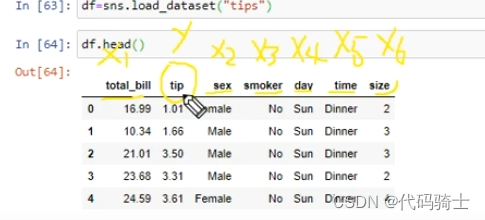
#df=sns.load_dataset("tips")
df = sns.load_dataset("tips",cache=True,data_home=r'.\seaborn-data')#本地数据集载入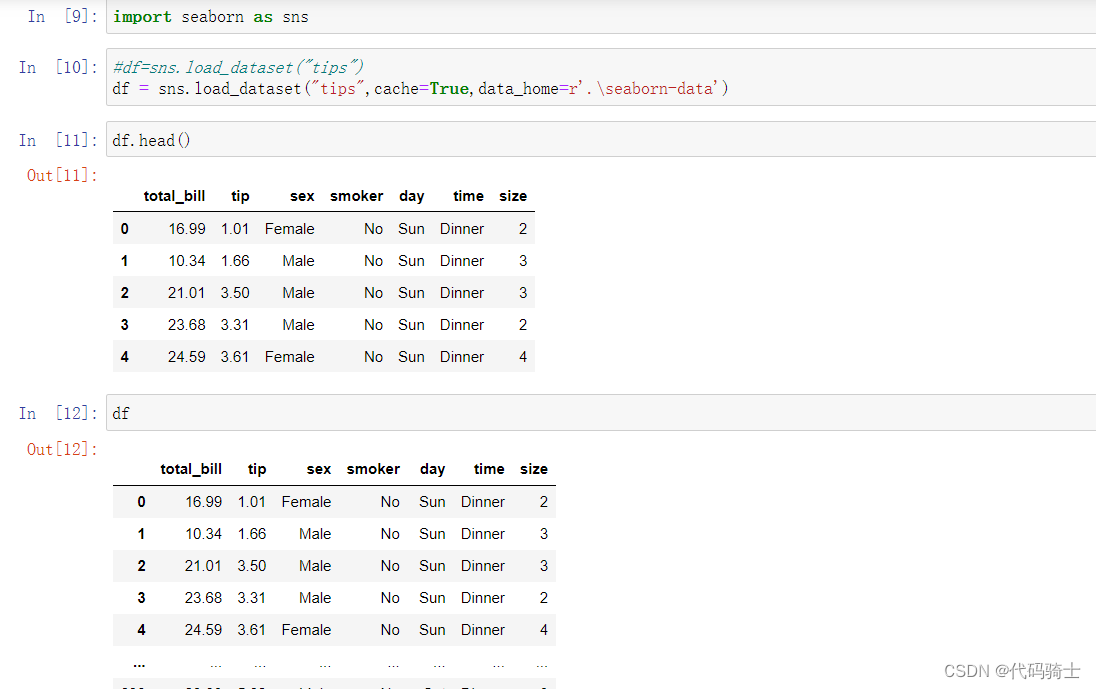
通过多元线性分析,我们可以把tips看做因变量,其他影响因素看做自变量。
Correlation with Heatmap相关性热图
A correlation heatmap uses colored cells, typically in a monochromatic scale, to show a 2D correlation matrix (table) between two discrete dimensions or event types. It is very important in Feature Selection
相关热图使用彩色单元(通常采用单色比例)来显示两个离散维度或事件类型之间的 2D 相关矩阵(表)。 在特征选择中非常重要
df.dtypes#查看数据类型
df.corr()#相关性矩阵
sns.heatmap(df.corr())#相关性热力图 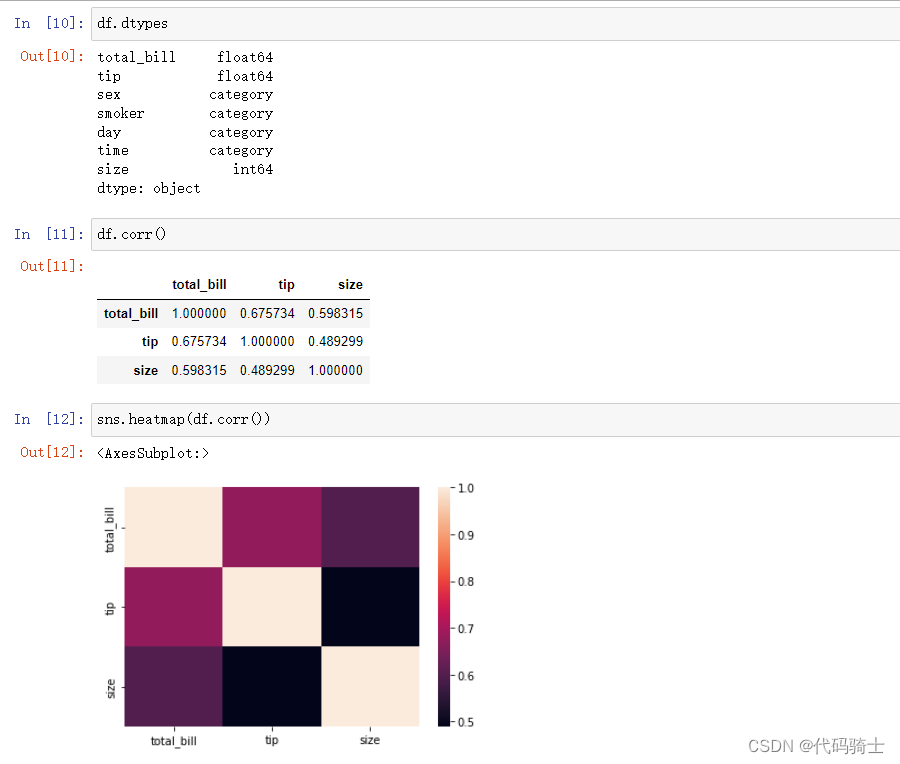
JoinPlot联合图
A join plot allows to study the relationship between 2 numeric variables. The central chart display their correlation. It is usually a scatterplot, a hexbin plot, a 2D histogram or a 2D density plot
连接图可以研究两个数值变量之间的关系。 中央图表显示了它们的相关性。 通常是散点图、六边形图、二维直方图或二维密度图。
sns.jointplot(x='tip',y='total_bill',data=df,kind='hex')#蜂窝图

sns.jointplot(x='tip',y='total_bill',data=df,kind='reg')#线性回归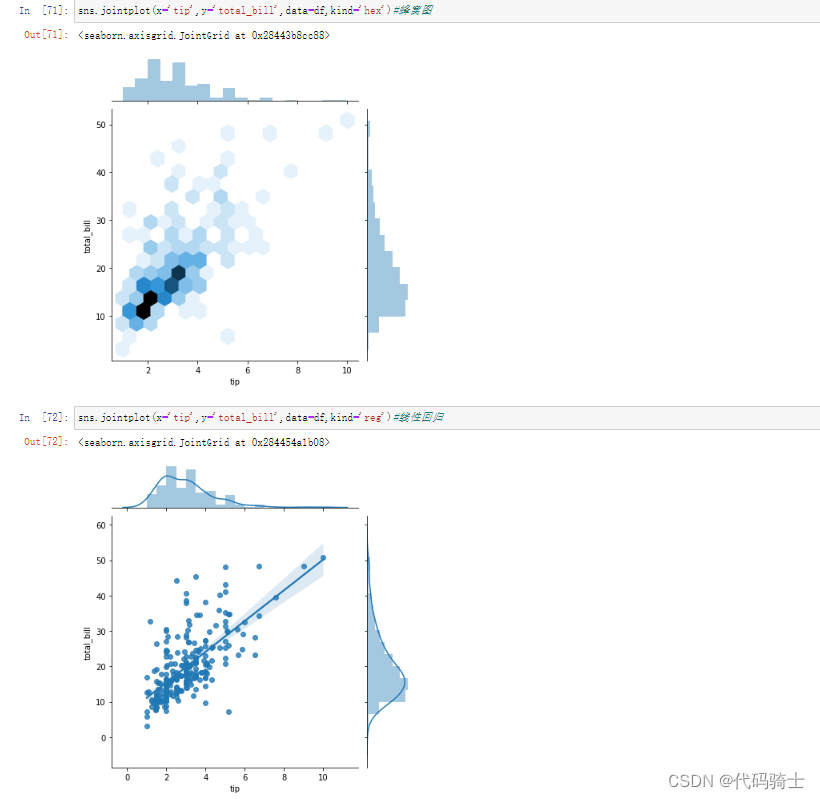
Pair plot配对图
A “pairs plot” is also known as a scatterplot, in which one variable in the same data row is matched with another variable's value, like this: Pairs plots are just elaborations on this, showing all variables paired with all the other variables
“配对图”也称为散点图,其中同一数据行中的一个变量与另一个变量的值相匹配,如下所示: 配对图只是对此的详细说明,显示与所有其他变量配对的所有变量
sns.pairplot(df)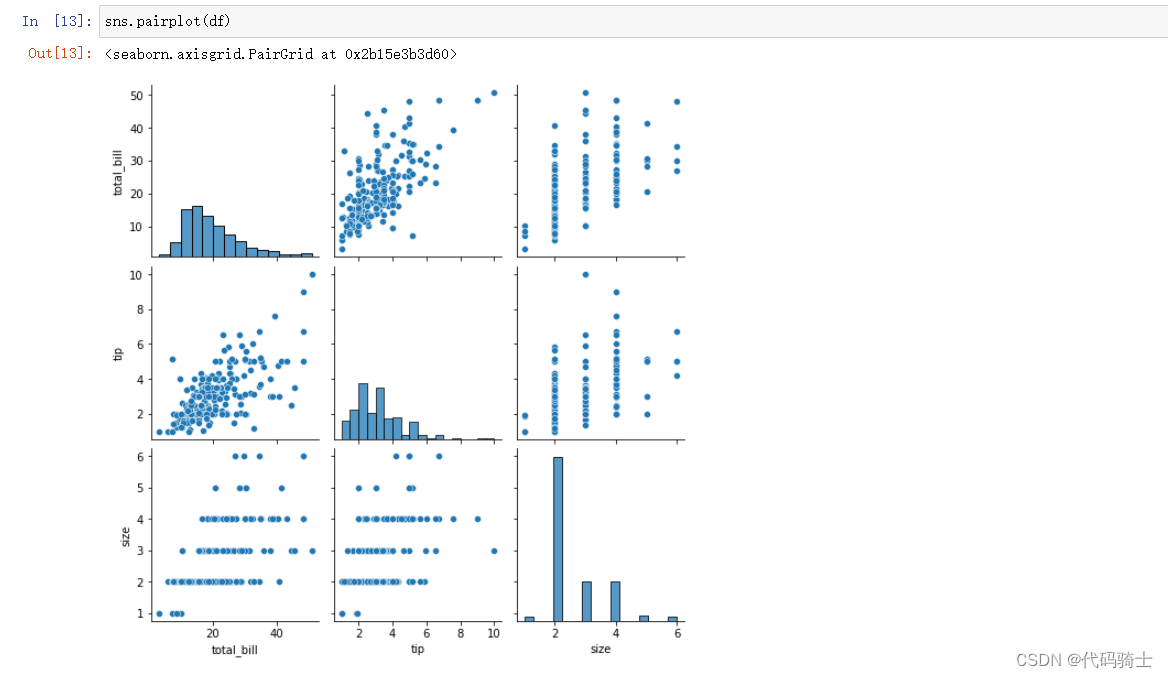
指定单一元素和其他元素的关系
sns.pairplot(df,hue='sex')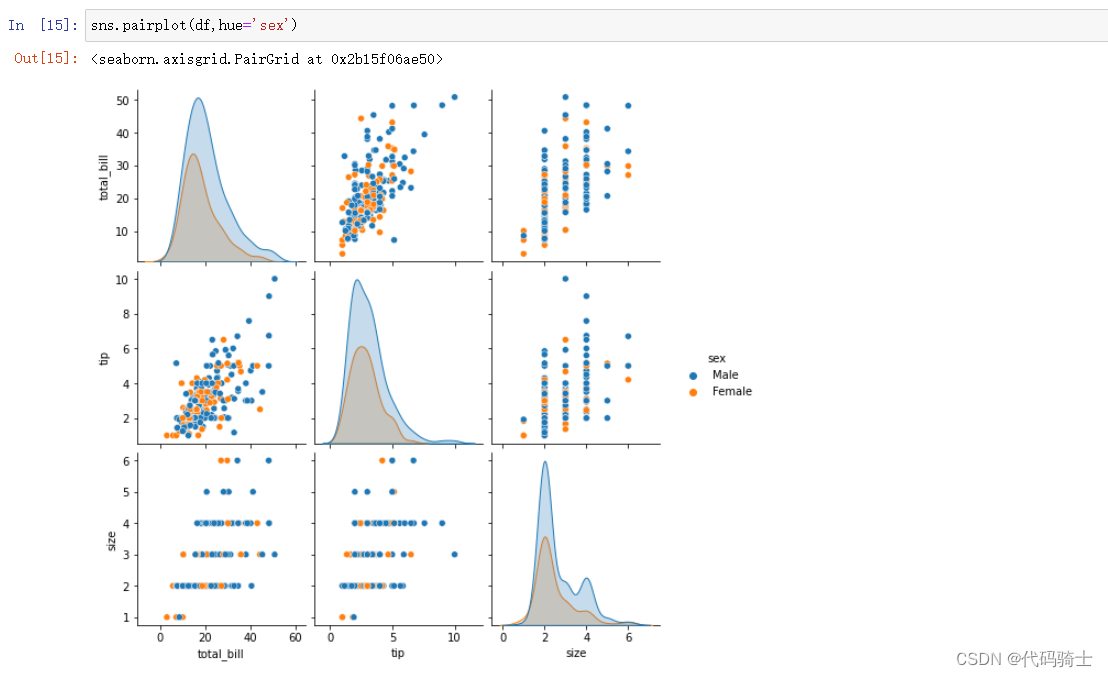
sns.pairplot(df,hue='smoker')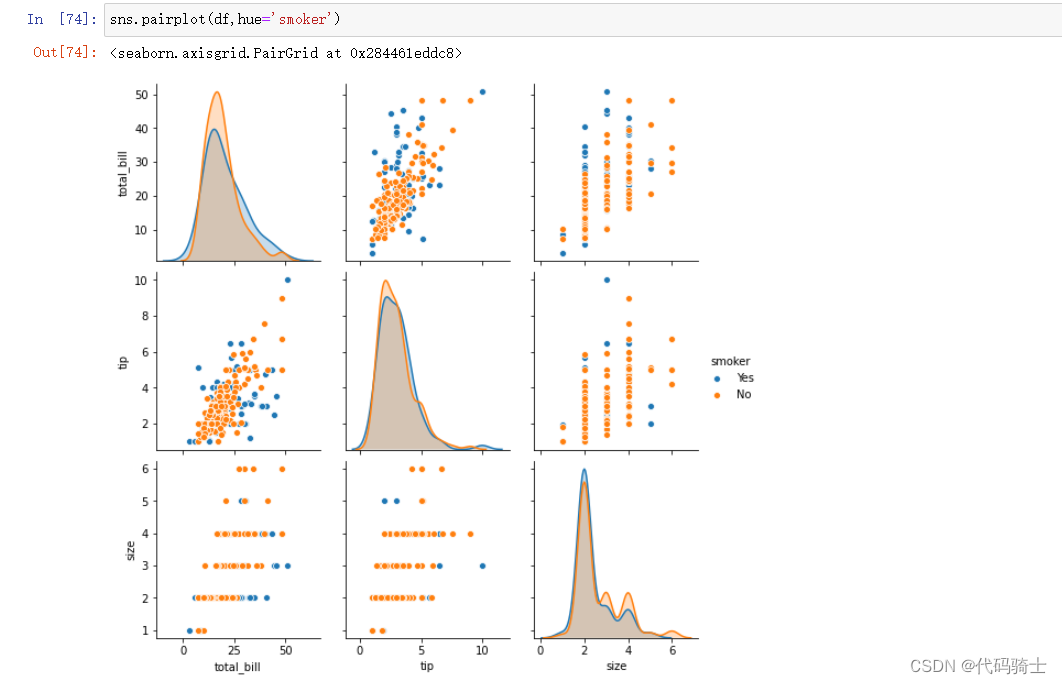
统计各列不同值个数
df['smoker'].value_counts()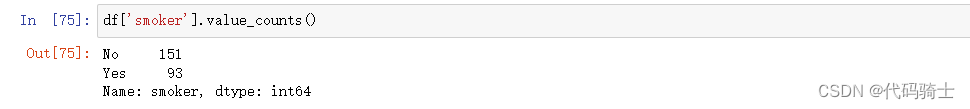
df['sex'].value_counts()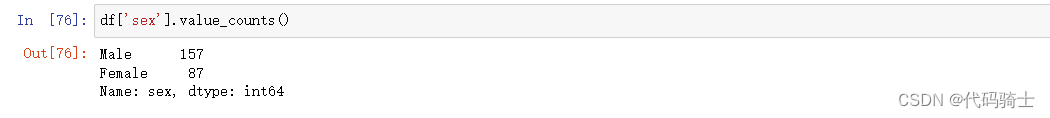
Dist plot分布图
Dist plot helps us to check the distribution of the columns feature
分布图帮助我们检查列特征的分布
sns.distplot(df['tip'])#显示tip分布百分比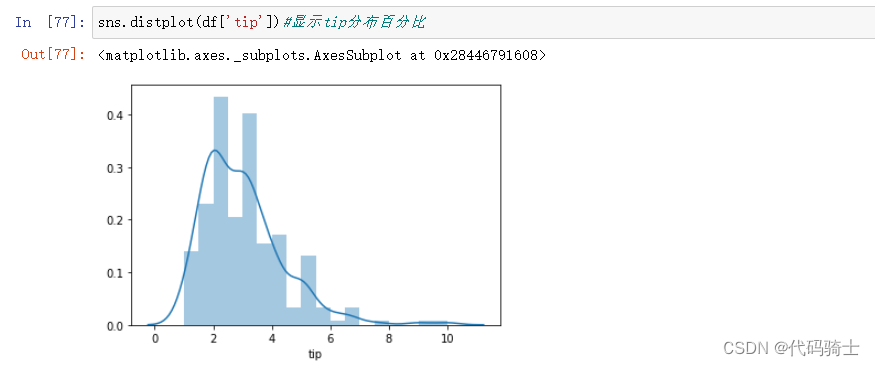
sns.distplot(df['tip'],kde=False,bins=20)#kde=False统计人数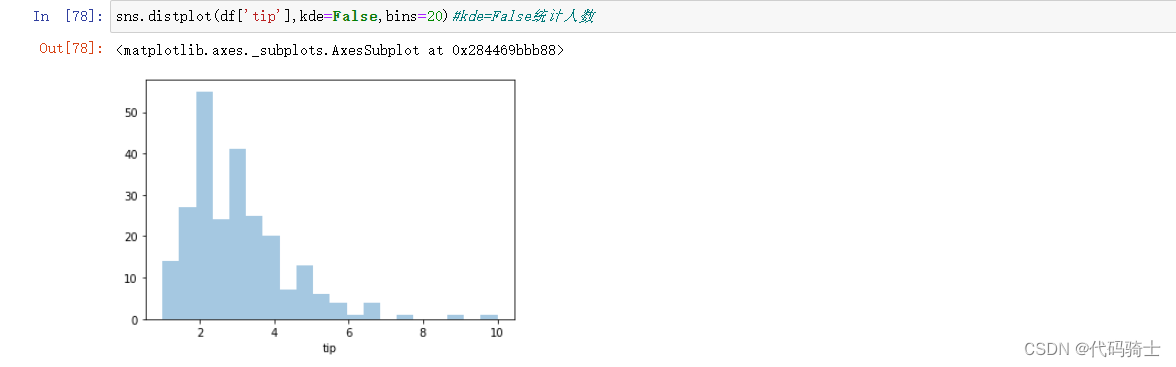
Categorical Plots分类图
Seaborn also helps us in doing the analysis on Categorical Data points. In this section we will discuss about
Seaborn 还帮助我们对分类数据点进行分析。 在本节中我们将讨论
## Count plot

sns.countplot('sex',data=df)#统计sex列不同值个数的统计情况

## Count plot

sns.countplot('smoker',data=df)#统计smoker列不同值个数的统计情况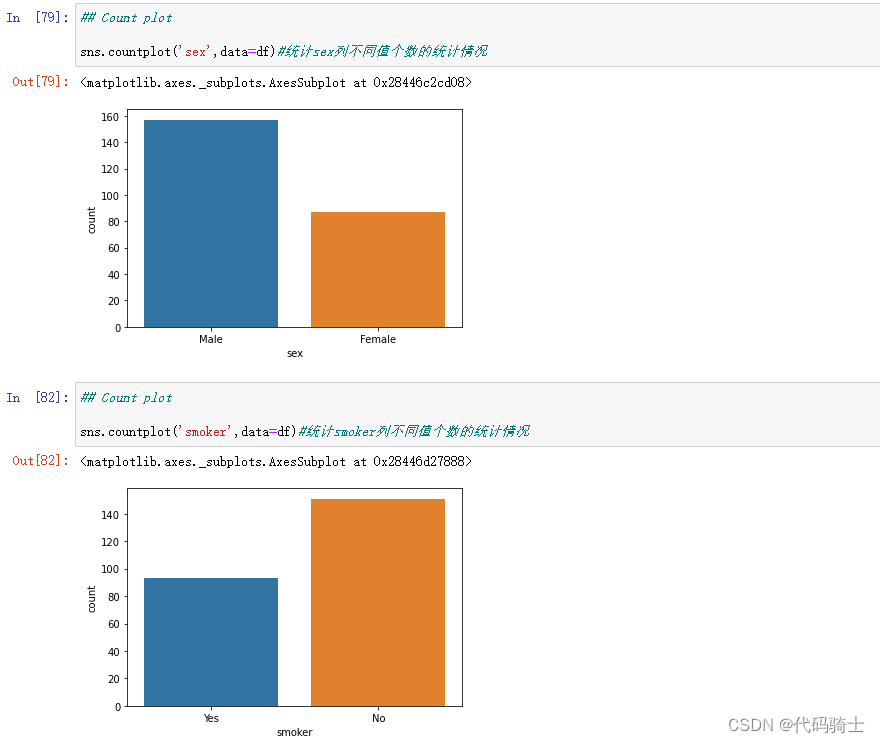
## Bar plot
sns.barplot(x='total_bill',y='sex',data=df)#统计total_bill和sex的数量关系(设置x、y轴)

## Bar plot
sns.barplot(x='sex',y='total_bill',data=df)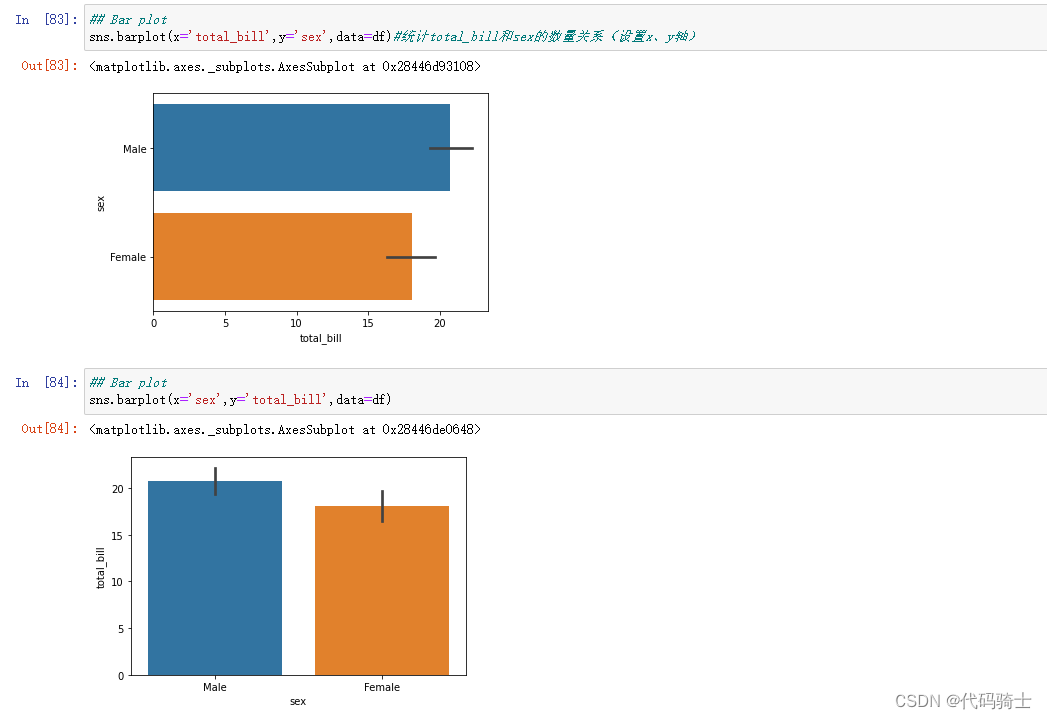
Box plot箱型图
A box and whisker plot (sometimes called a boxplot) is a graph that presents information from a five-number summary.
箱须图(有时称为箱线图)是一种显示五数摘要信息的图表。
sns.boxplot('smoker','total_bill', data=df)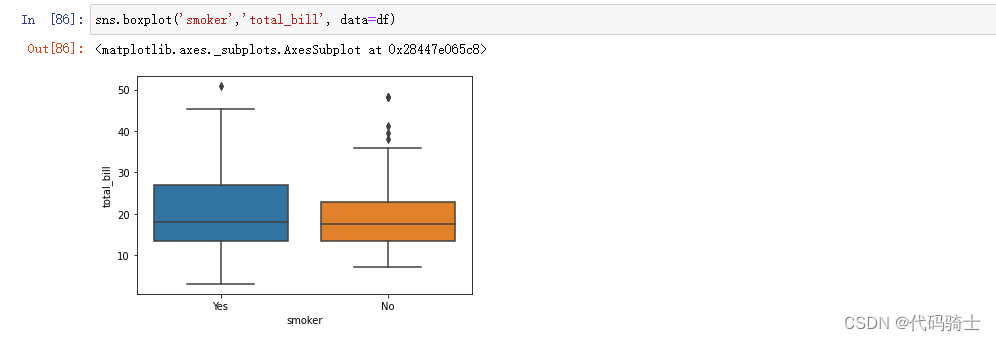
sns.boxplot(x="day", y="total_bill", data=df,palette='rainbow')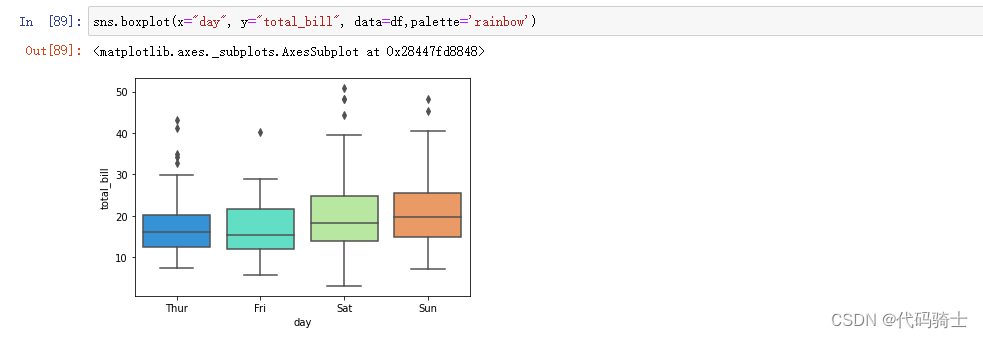
sns.boxplot(data=df,orient='v')#orient=v方向是垂直的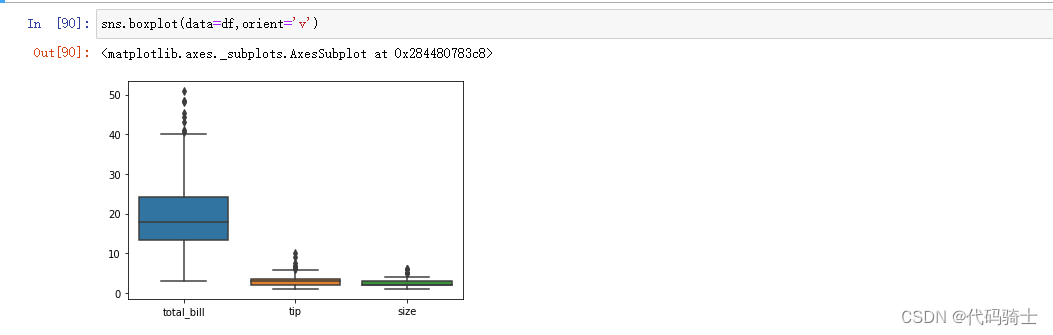
sns.boxplot(data=df,orient='h')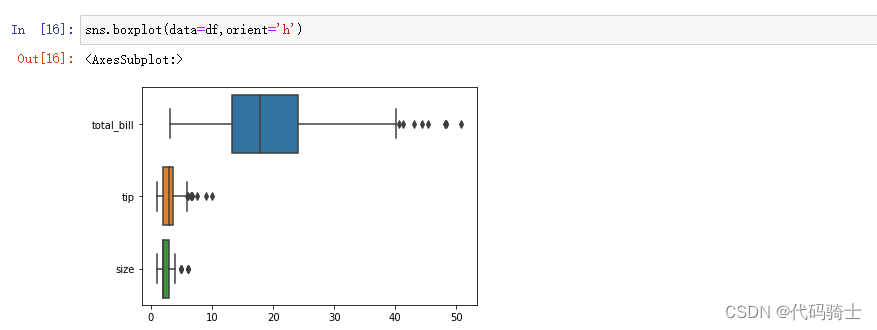
# categorize my data based on some other categories

sns.boxplot(y="total_bill", x="day", hue="sex",data=df)#hue代表箱体元素 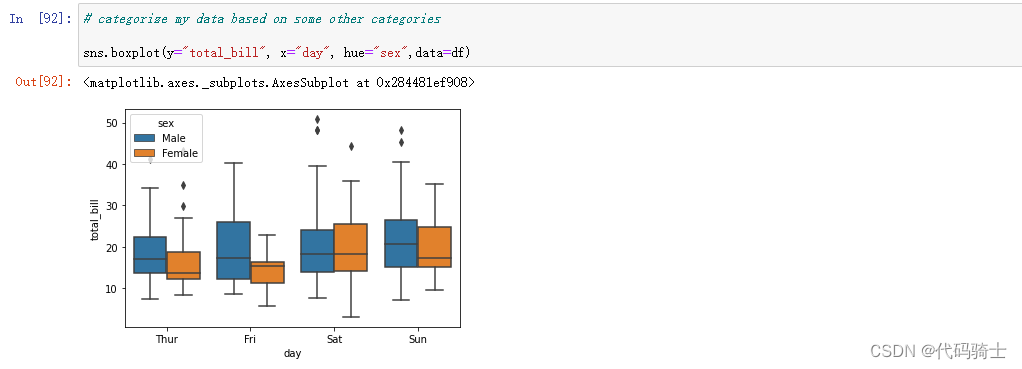
Violin Plot小提琴图
Violin plot helps us to see both the distribution of data in terms of Kernel density estimation and the box plot
小提琴图帮助我们了解核密度估计和箱线图方面的数据分布
sns.violinplot(y="total_bill", x="day", data=df,palette='rainbow')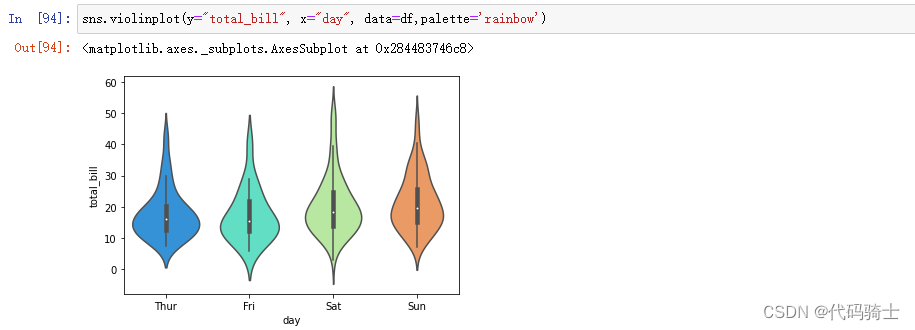
sns.violinplot(x="total_bill", y="day", data=df,palette='rainbow')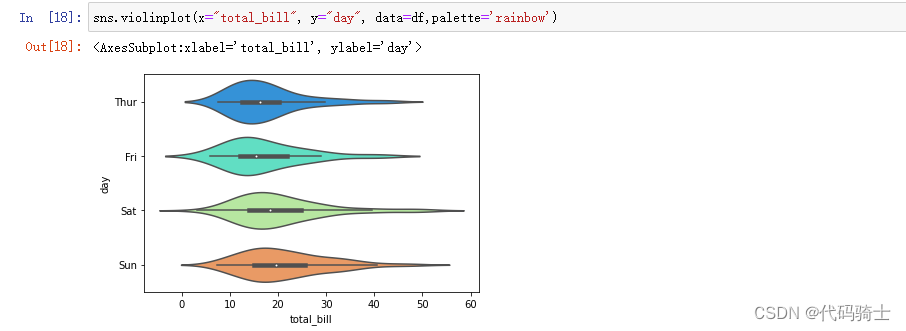
P7-If、for、while及Functions函数
Functions in Python. A function is a set of statements that take inputs, do some specific computation and produces output. These functions are called user defined function
Python 中的函数。函数是一组语句,它们接受输入,执行一些特定的计算并产生输出。这些函数称为用户定义函数
Function Definition
函数定义
Positional and Keyword Arguments in Functions 位置参数(positional argument )和关键字参数(keyword argument)
函数中的位置参数和关键字参数位置参数(位置参数)和关键字参数(关键字参数)
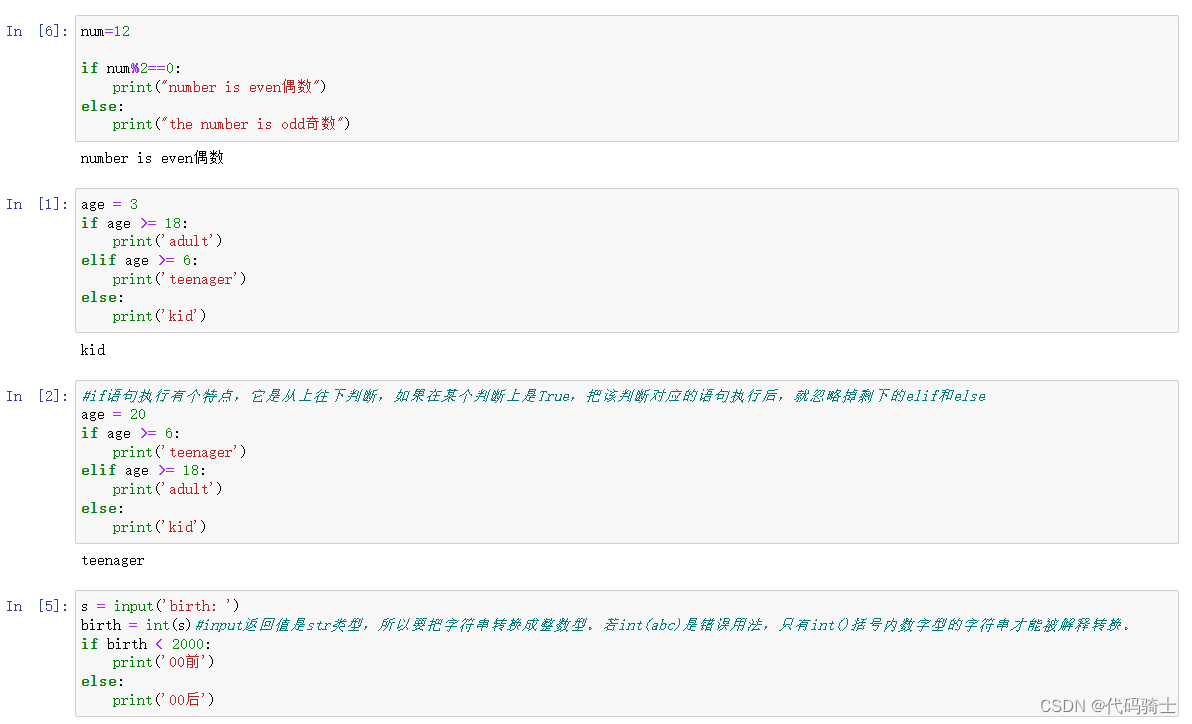
If条件语句
for、while循环
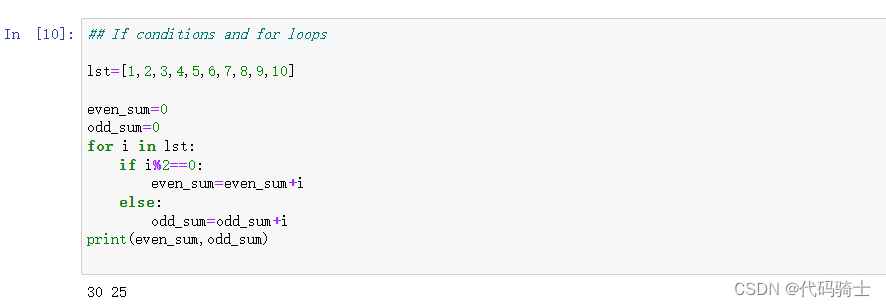
## If conditions and for loops

lst=[1,2,3,4,5,6,7,8,9,10]

even_sum=0
odd_sum=0
for i in lst:
    if i%2==0:
        even_sum=even_sum+i
    else:
        odd_sum=odd_sum+i
print(even_sum,odd_sum)
names = ['Michael', 'Bob', 'Tracy']
for name in names:
    print(name)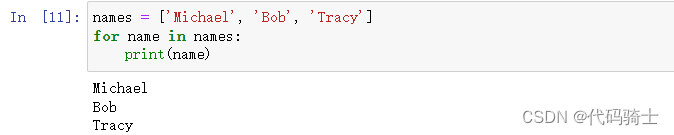
names = ['Michael', 'Bob', 'Tracy']
for name in names:
    print(name)
sum = 0
for x in [1, 2, 3, 4, 5, 6, 7, 8, 9, 10]:
sum = sum + x
print(sum)#如果要计算1-100的整数之和,从1写到100有点困难,
#幸好Python提供一个range()函数,可以生成一个整数序列,
#再通过list()函数可以转换为list。比如range(5)生成的序列是从0开始小于5的整数:
list(range(5))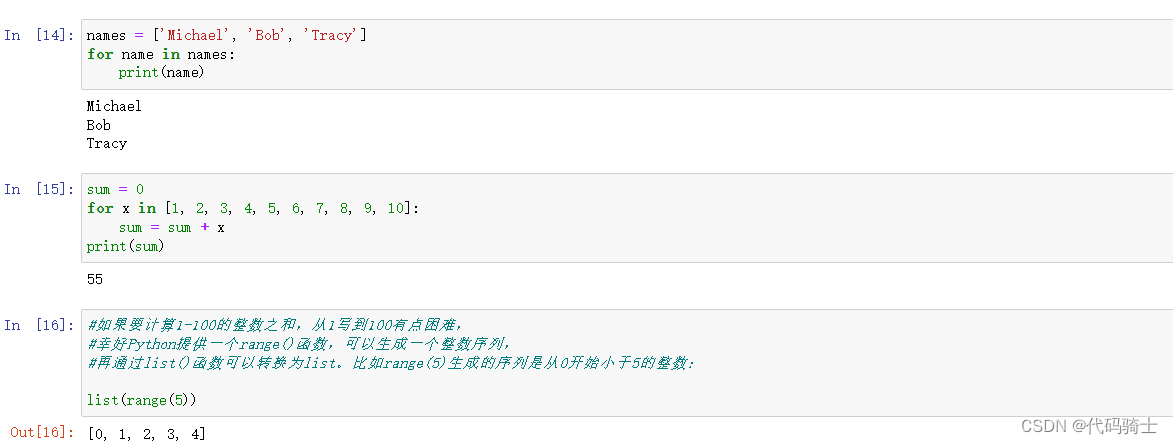
break、continue关键字
#break语句可以提前退出循环。
n = 1
while n <= 100:
    if n > 10: # 当n = 11时,条件满足,执行break语句
        break # break语句会结束当前循环
    print(n)
    n = n + 1
print('END')
#continue语句,跳过当前的这次循环,直接开始下一次循环。
n = 0
while n < 10:
n = n + 1
if n % 2 == 0: # 如果n是偶数,执行continue语句
continue # continue语句会直接继续下一轮循环,后续的print()语句不会执行
print(n)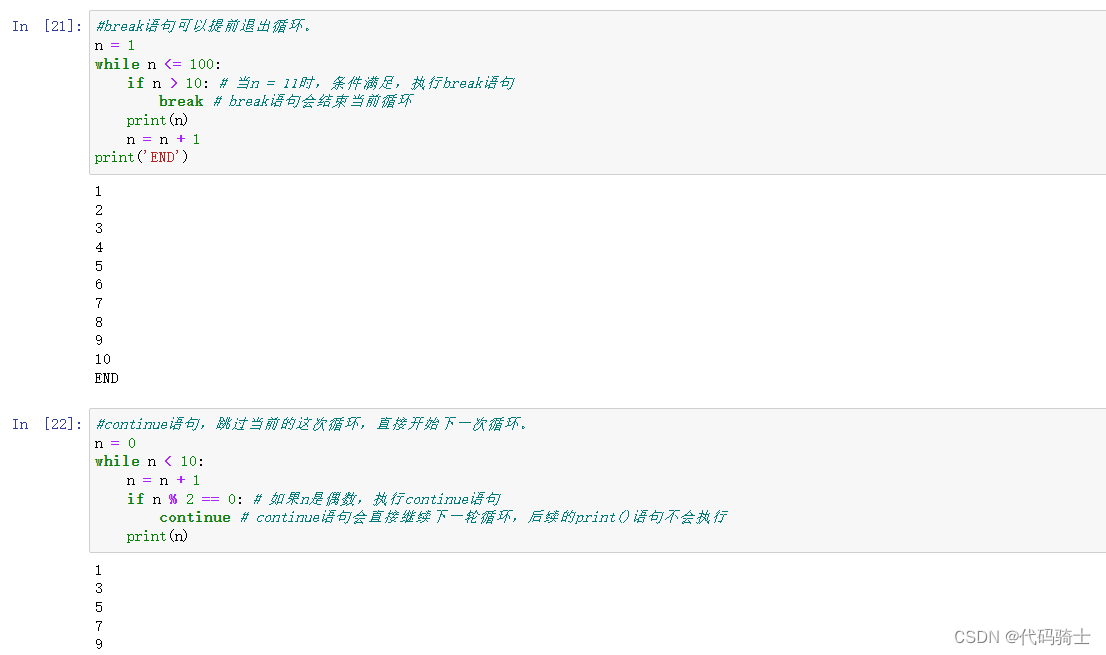
function函数
无参数函数
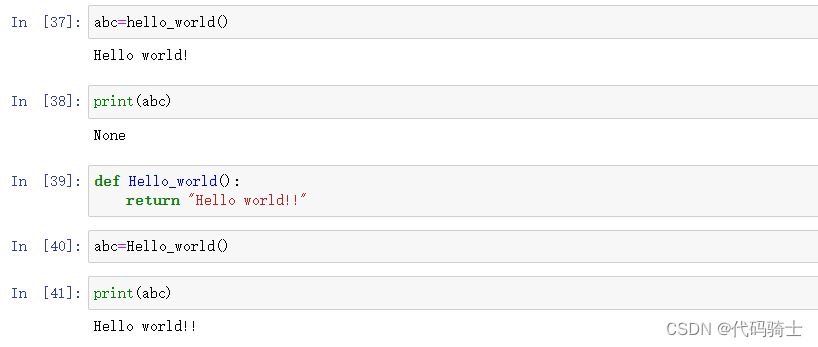
定义一个无参数无返回值的函数
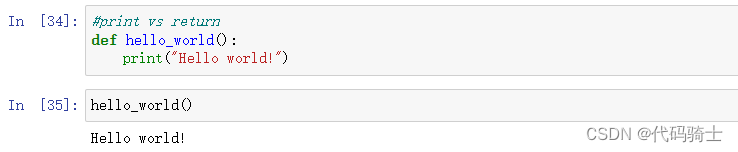
定义一个无参数有返回值的函数
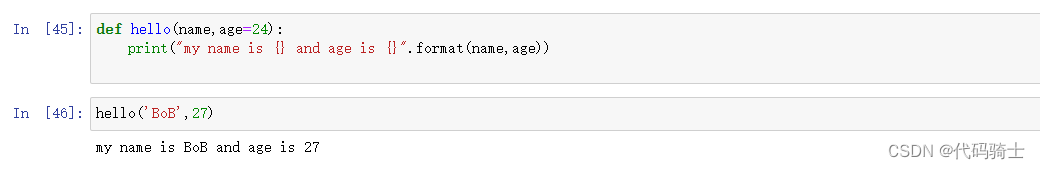
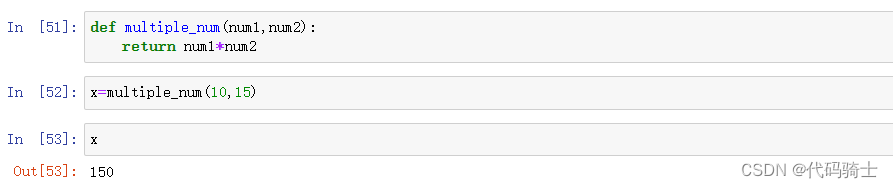
有参数函数
定义一个有参数无返回值的函数
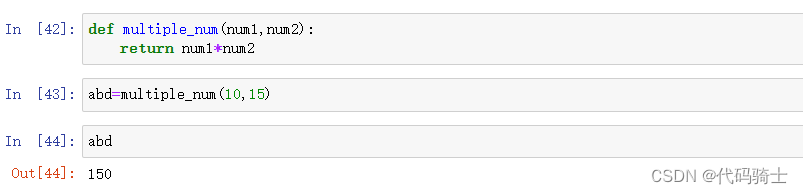
定义一个有参数有返回值的函数
函数参数分类
位置参数
正常的普通的value参数
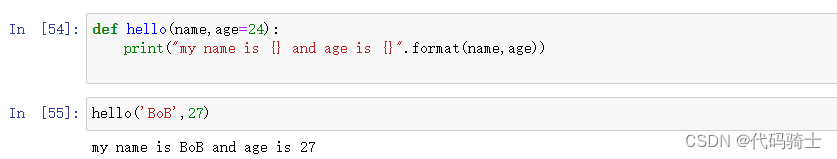
默认参数
参数传递值时没有接收到value,则按照默认参数值进行传递
可变参数
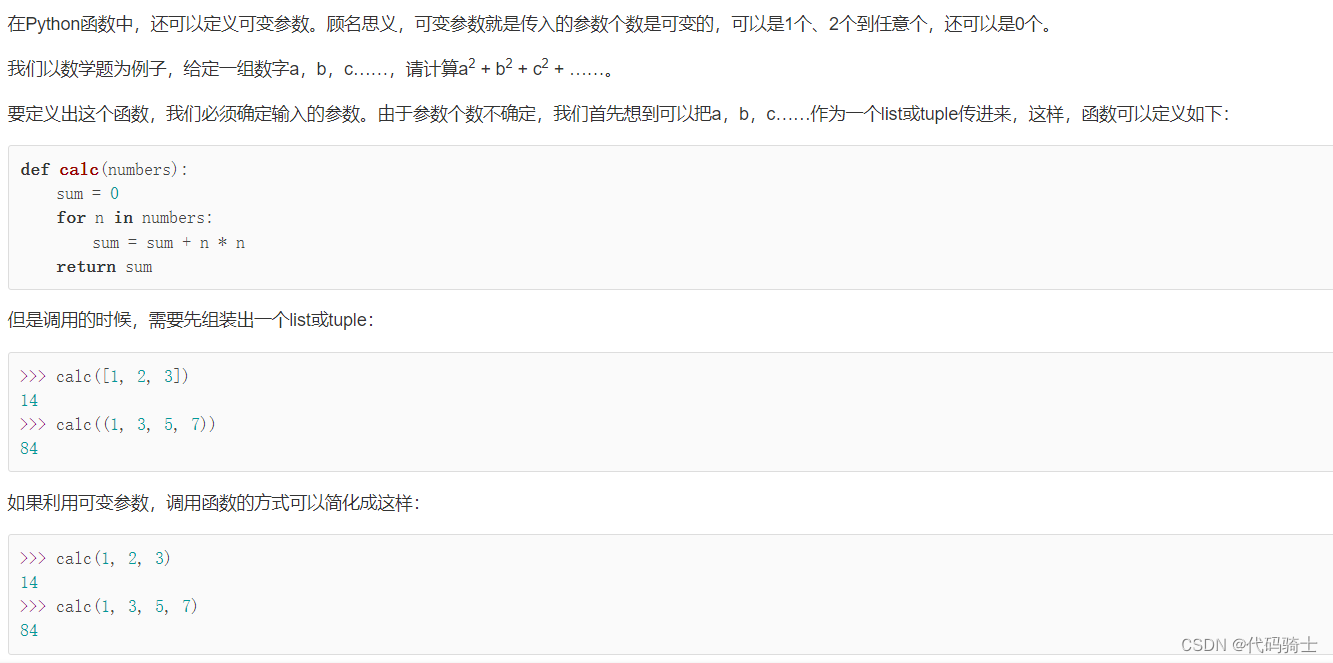
在Python函数中,还可以定义可变参数。顾名思义,可变参数就是传入的参数个数是可变的,可以是1个、2个到任意个,还可以是0个。
def calc(*numbers):
    sum = 0
    for n in numbers:
        sum = sum + n * n
return sum定义可变参数和定义一个list或tuple参数相比,仅仅在参数前面加了一个*号。在函数内部,参数numbers接收到的是一个tuple,因此,函数代码完全不变。但是,调用该函数时,可以传入任意个参数,包括0个参数
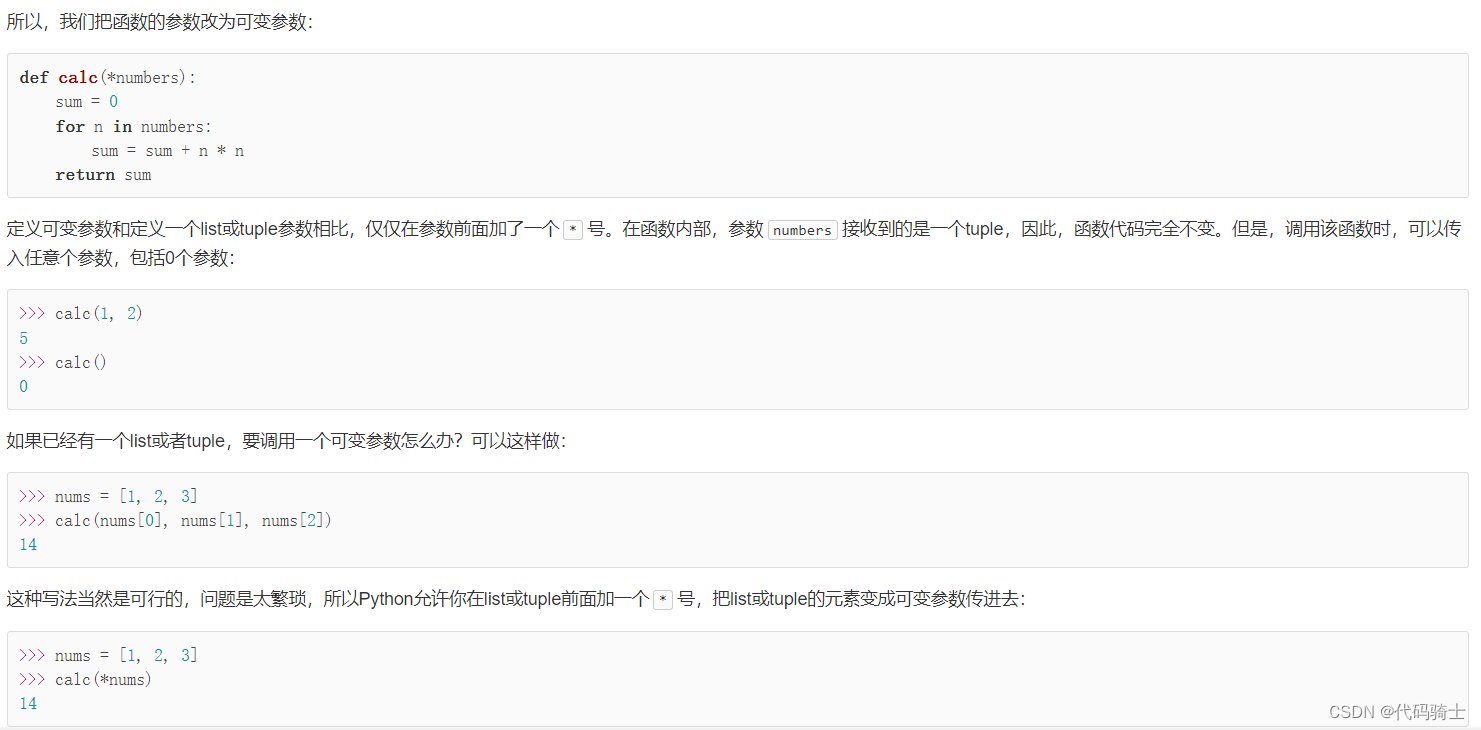
*nums表示把nums这个list的所有元素作为可变参数传进去。这种写法相当有用,而且很常见。
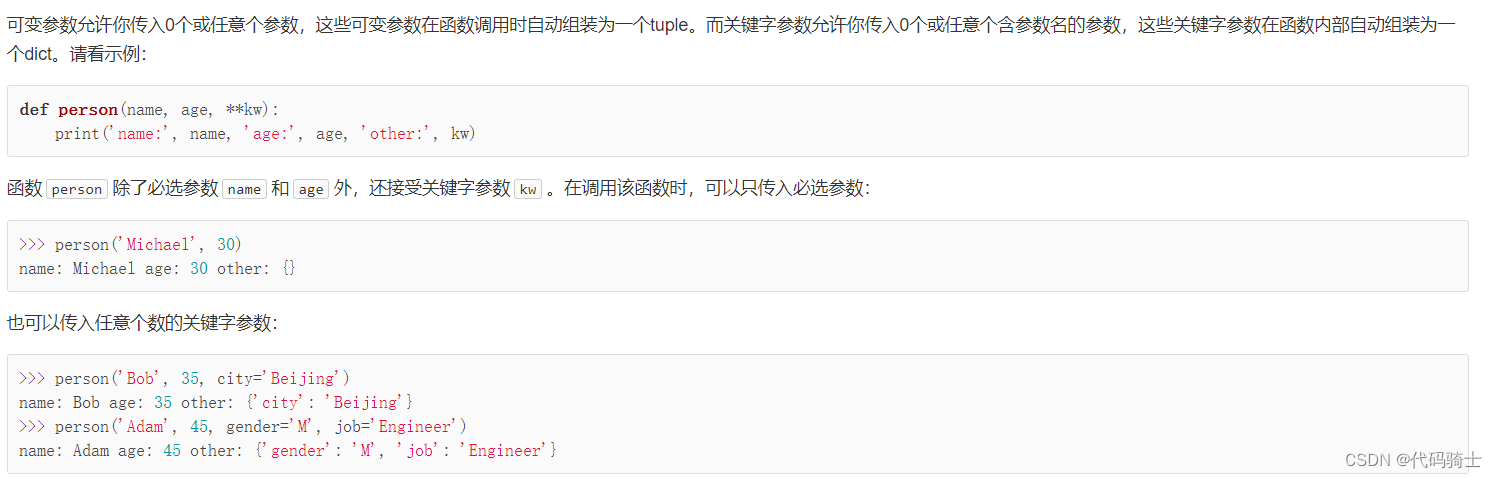
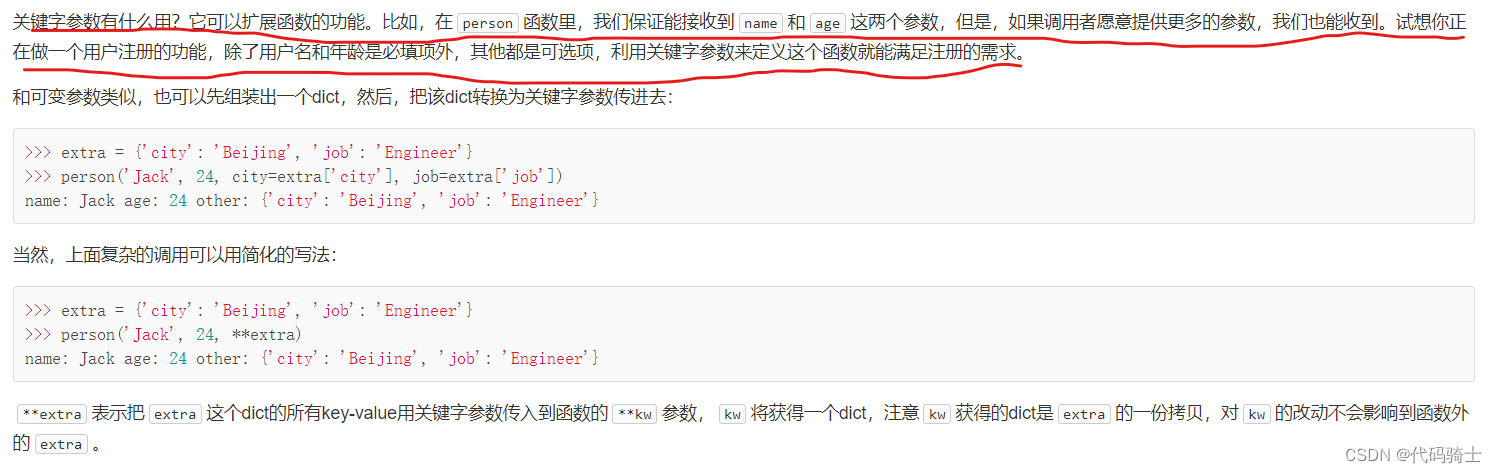
关键字参数
可变参数允许你传入0个或任意个参数,这些可变参数在函数调用时自动组装为一个tuple。而关键字参数允许你传入0个或任意个含参数名的参数,这些关键字参数在函数内部自动组装为一个dict。请看示例:
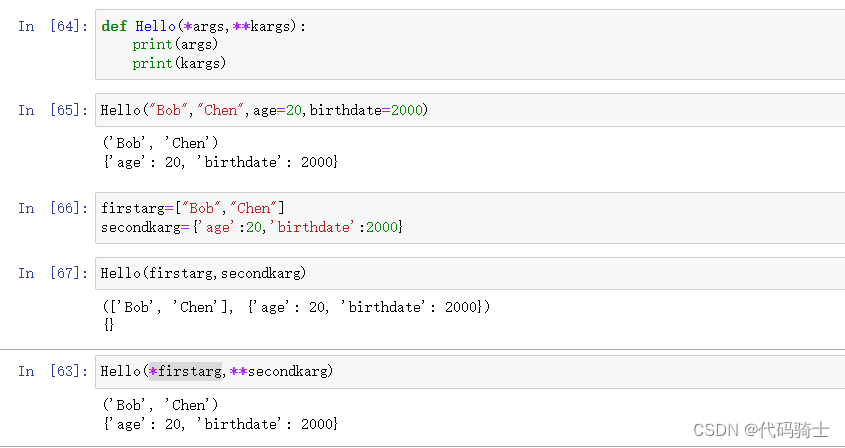
 可变和关键字参数二者最明显的区别就是:可变参数前有一个*,返回一个元组。关键字参数前有两个*,返回一个字典。
更多函数参数的内容可以参考函数的参数 - 廖雪峰的官方网站
P8-Lambda, Map, Filter, List Comprehension
-Lambda:a small function with no name. A lambda function can take any number of arguments, but can only have one expression.
Lambda:一个没有名字的小函数。Lambda 函数可以接受任意数量的参数,但只能有一个表达式。
-Map:Python’s map() is a built-in function that allows you to process and transform all the items in an iterable without using an explicit for loop
Map:Python 的 Map ()是一个内置函数,它允许您在不使用显式 for 循环的情况下处理和转换可迭代文件中的所有项
-Filter: The filter() method constructs an iterator from elements of an iterable for which a function returns true. In simple words, filter() method filters the given iterable with the help of a function that tests each element in the iterable to be true or not
Filter: Filter ()方法从函数返回 true 的迭代器元素中构造迭代器。简单来说,filter ()方法通过一个函数来过滤给定的迭代,该函数测试迭代中的每个元素是否为真
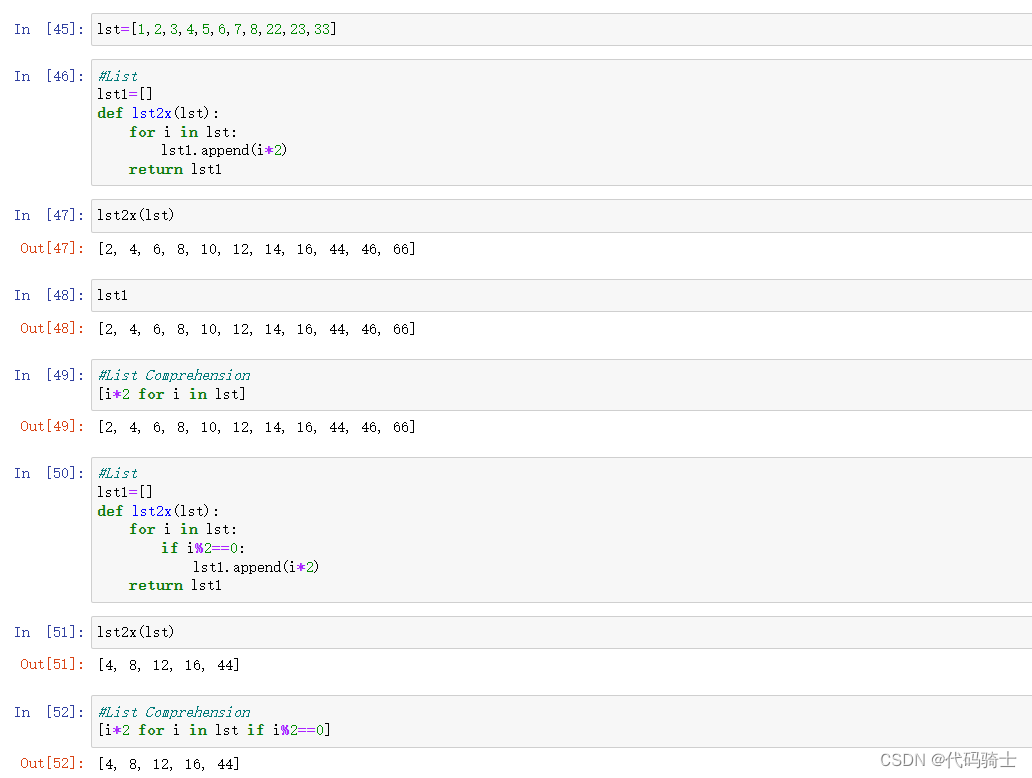
-List comprehensions provide a concise way to create lists.It consists of brackets containing an expression followed by a for clause, then zero or more for or if clauses. The expressions can be anything, meaning you can put in all kinds of objects in lists.
列表理解提供了一种创建列表的简洁方法。它包括括括号,表达式后跟一个 for 子句,然后是0或更多 for 或 if 子句。表达式可以是任何形式,这意味着您可以在列表中放入各种类型的对象。
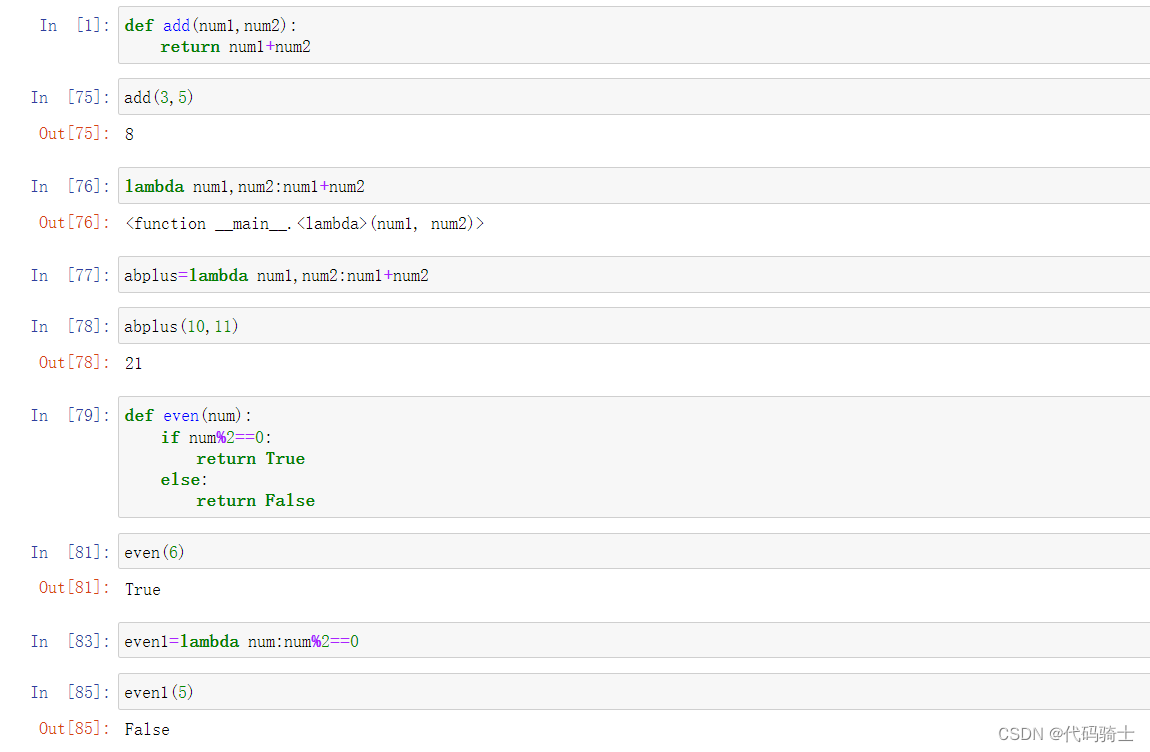
Lambda表达式
一行简写的函数
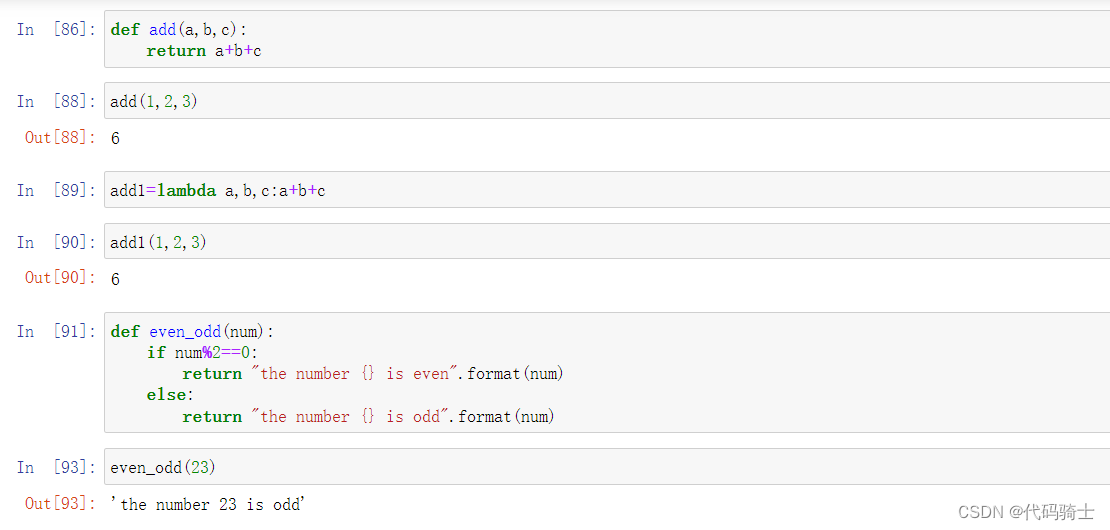
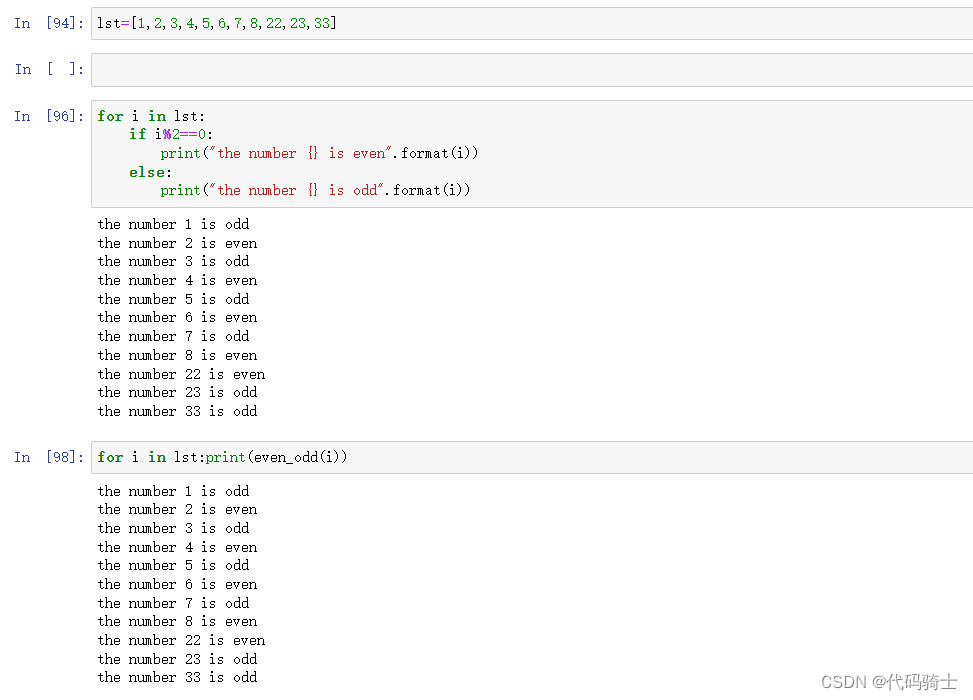
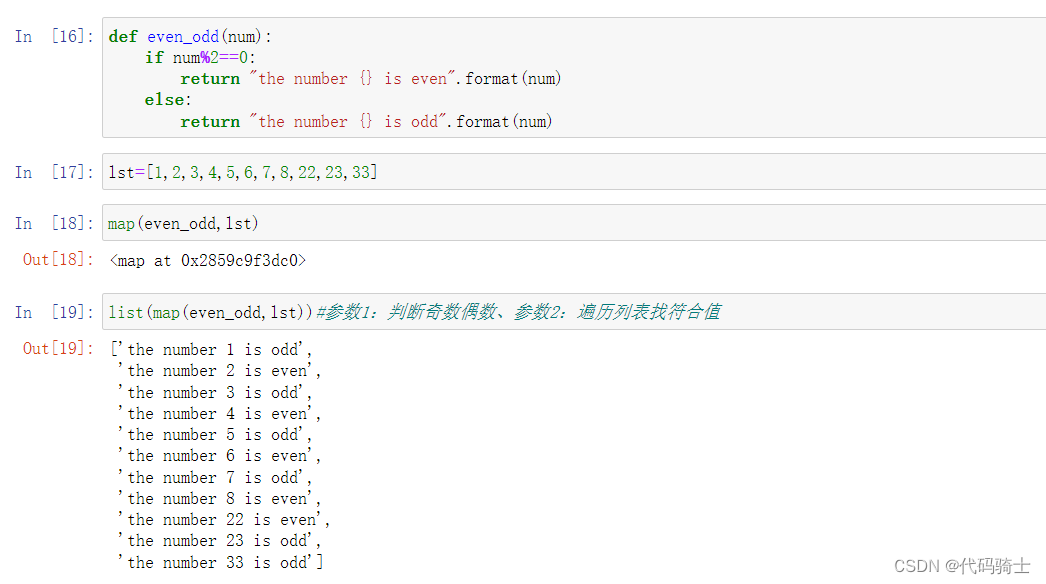
Map映射函数
映射、遍历
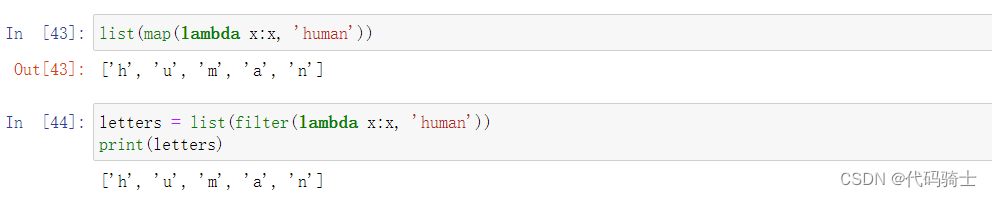
Filter过滤器
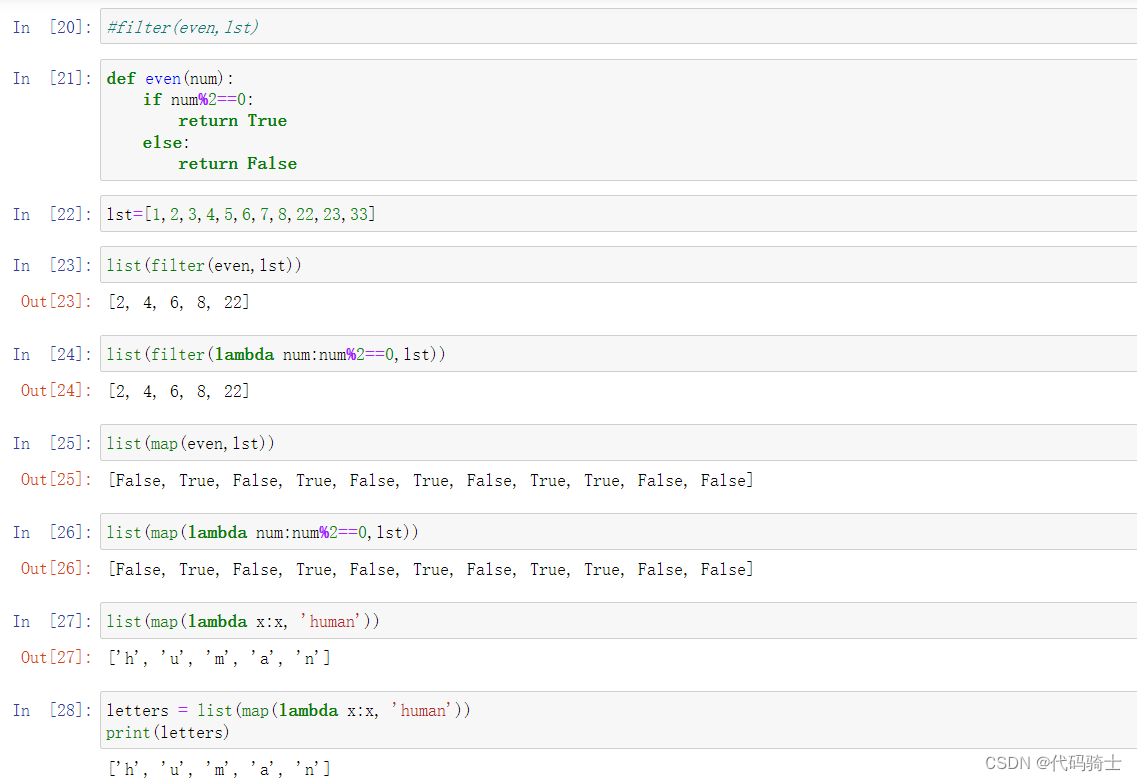
Map和filter的区别
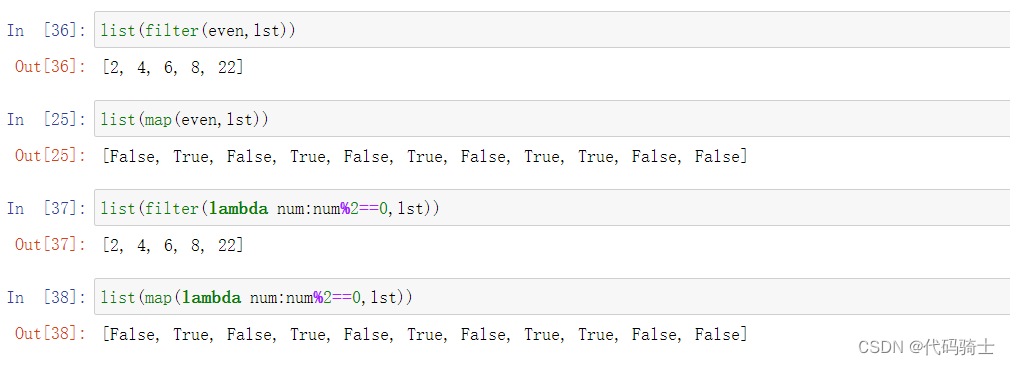 与lambda表达式的混用
List comprehensions列表表达式
P9- String, Iterables vs Iterators, Pyforest
字符串,Iterables vs 迭代器,Pyforest
Iterable: List, string, tuple, files, etc
可迭代对象: 列表、字符串、元组、文件等
Iterable can create Iterators which works on Iterable
迭代对象可以创建一个可以在迭代对象上工作的迭代器
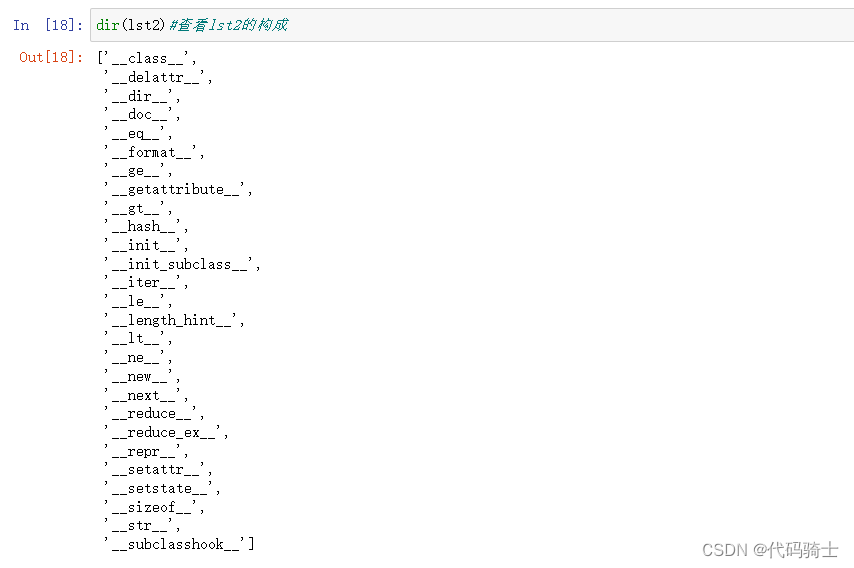
Iterable is an object, which one can iterate over. Iterator is an object, which is used to iterate over an iterable object using next() method.
Iterable 是一个对象,可以对其进行迭代。Iterator 是一个对象,用于使用 next ()方法在可迭代对象上进行迭代。
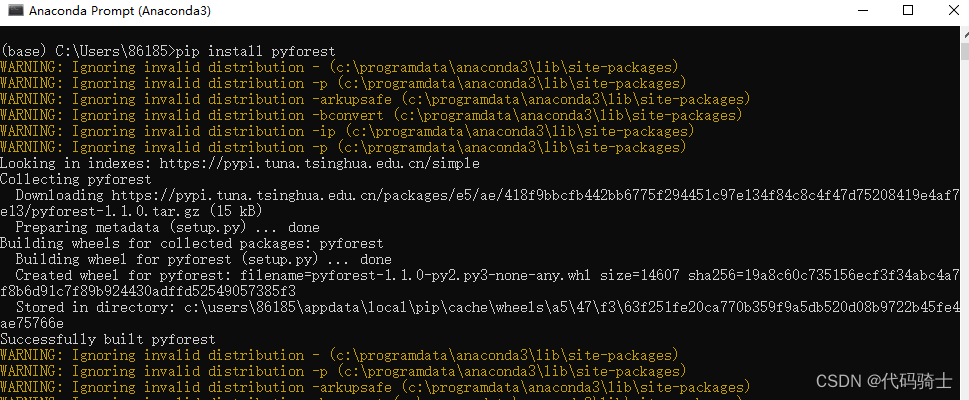
Pyforest——pip install Pyforest.
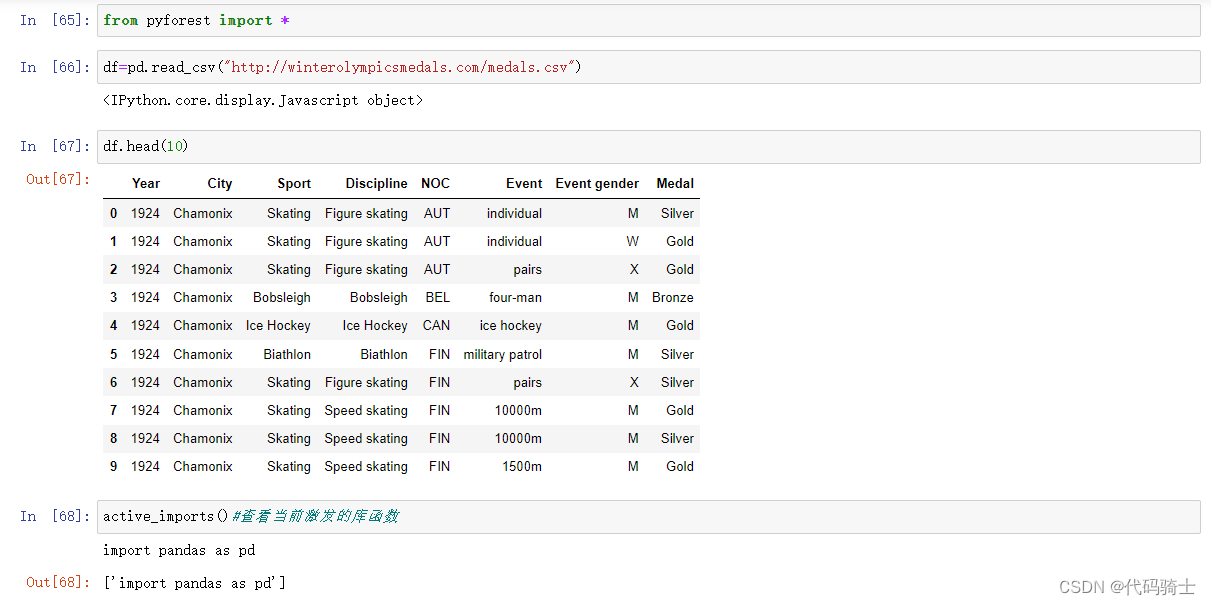
Lazy-import of all popular Python Data Science libraries. Stop writing the same imports over and over again. With pyforest you can use all your favorite Python libraries without importing them before. If you use a package that is not imported yet, pyforest imports the package for you and adds the code to the first Jupyter cell. If you don't use a library, it won't be imported.
延迟导入所有流行的 Python 数据科学库。停止一遍又一遍地编写相同的导入。通过 pyForest,您可以使用所有您喜欢的 Python 库,而无需以前导入它们。如果您使用一个尚未导入的包,pyForest 将为您导入该包,并将代码添加到第一个 Jupiter 单元格中。如果不使用库,就不会导入它。
String
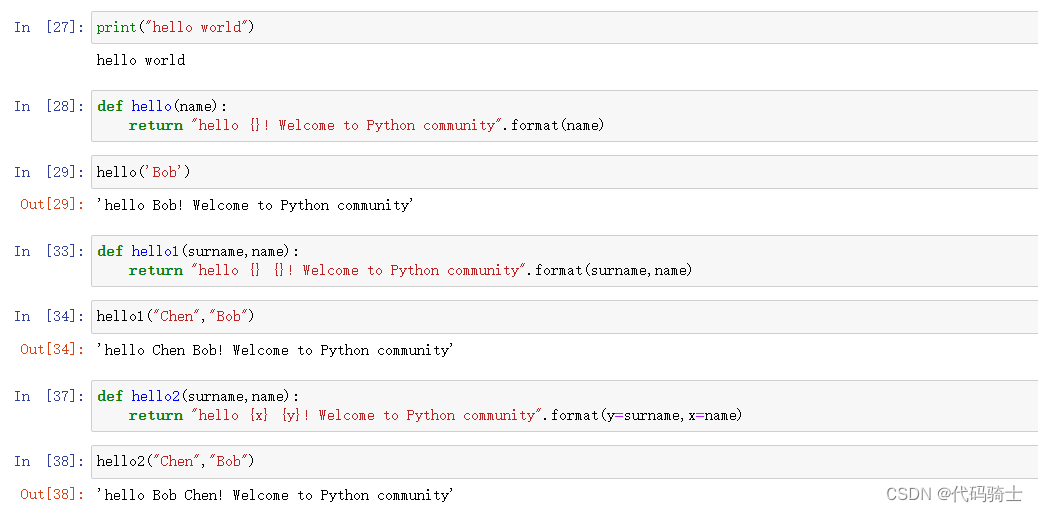
复习字符串、格式化输出
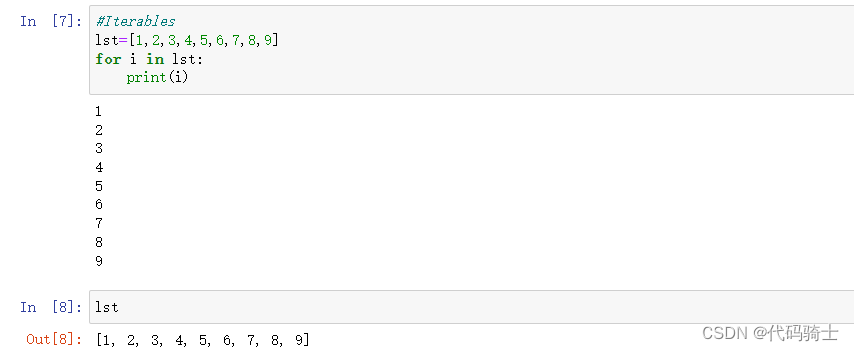
Iterables vs Iterators
简单理解Iterables开辟整个地址空间,是存储整个容器的对象例如列表、字符串、元组等。Iterators是开辟的一块地址空间,用来存储一个元素。可以通过next()函数获取容器中的某个元素。使用next获取元素后会释放掉该元素的存储空间。
Iterables
iter()函数
Docstring:
iter(iterable) -> iterator
iter(callable, sentinel) -> iterator
iter(lst)#将Iterables转化成IteratorsIterators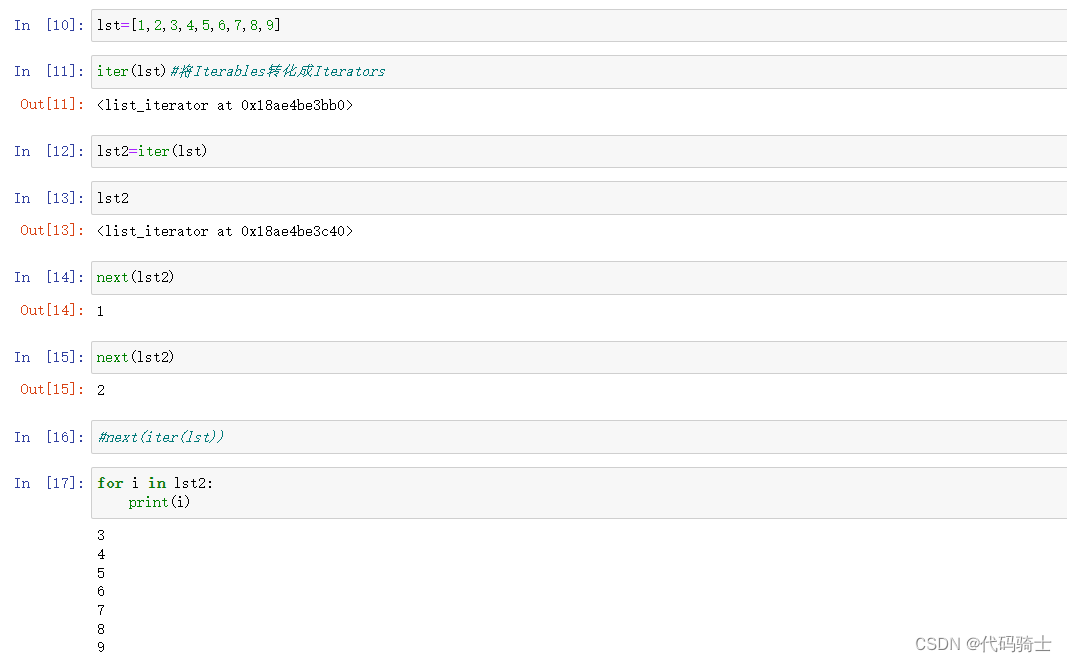
Pyforest
延迟导入所有流行的 Python 数据科学库。停止一遍又一遍地编写相同的导入。通过 pyForest,您可以使用所有您喜欢的 Python 库,而无需以前导入它们。如果您使用一个尚未导入的包,pyForest 将为您导入该包,并将代码添加到第一个 Jupiter 单元格中。如果不使用库,就不会导入它。
from pyforest import *
类似于java中的 import java.util.*
C语言中的 include<bits/stdc++.h>
在命令环境中安装Pyforest库:pip install pyforest
from pyforest import *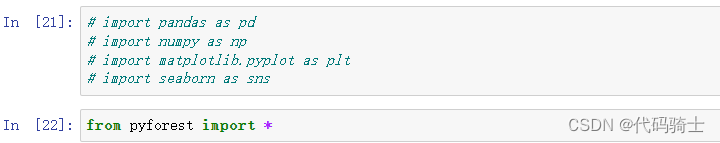
from pyforest import *
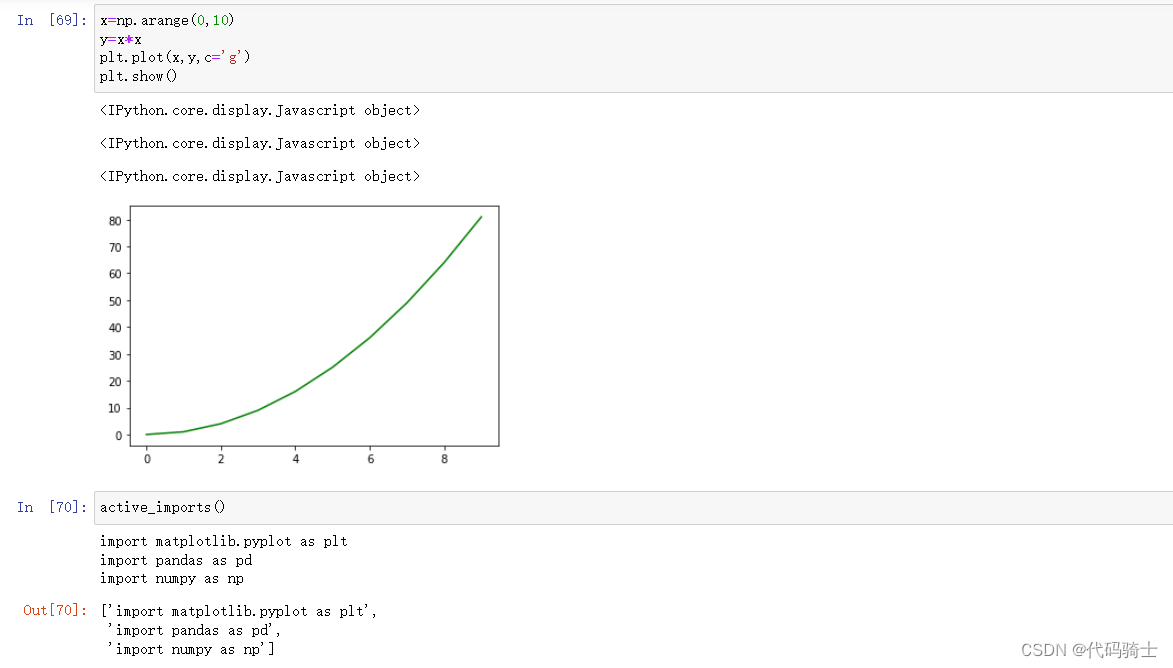
x=np.arange(0,10)
y=x*x
plt.plot(x,y,c='g')
plt.show()
plt.savefig('xxx.jpg')
active_imports()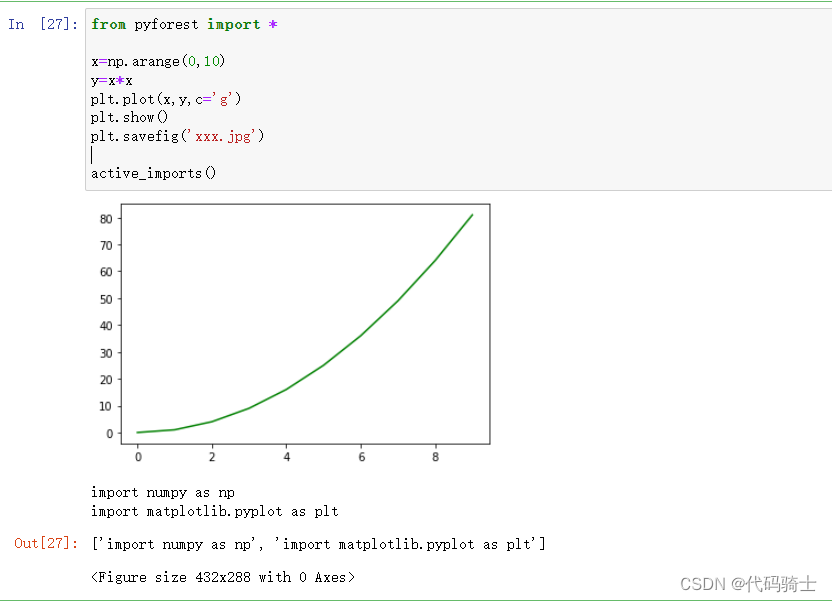
P10-Classes, Variables, Methods and Objects
类、变量、方法和对象
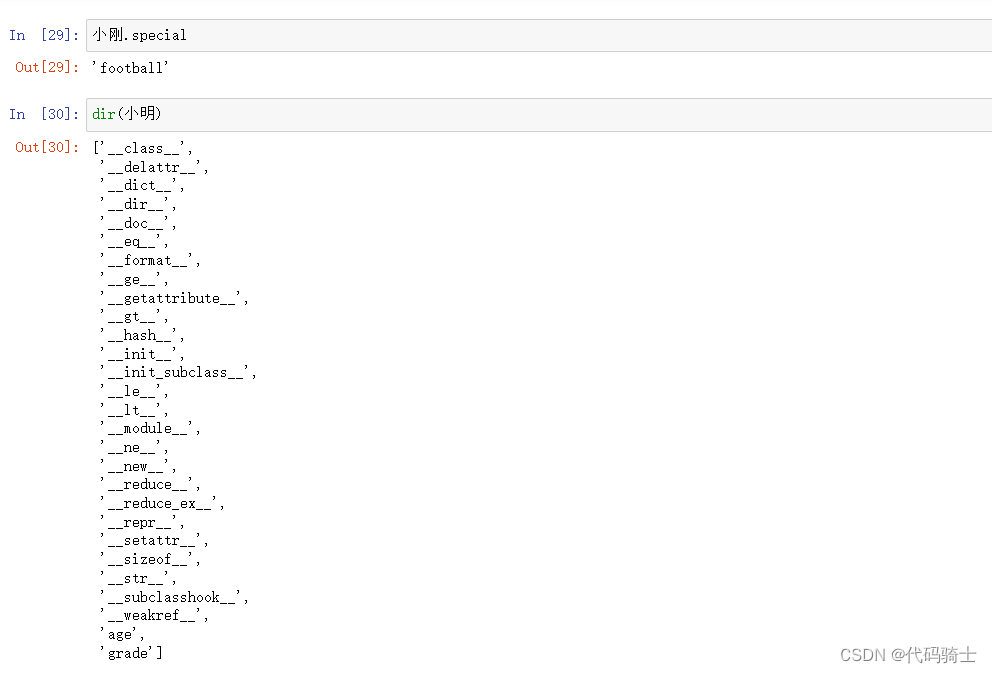
Class − A user-defined prototype for an object that defines a set of attributes that characterize any object of the class. The attributes are data members (class variables and instance variables) and methods, accessed via dot notation.
类——一个用户定义的对象原型,它定义了一组特征化类的任何对象的属性。属性是数据成员(类变量和实例变量)和方法,通过点符号访问。
Instance − An individual object of a certain class. An object obj that belongs to a class Circle, for example, is an instance of the class Circle.
实例-某个类的单个对象。例如,属于类 Circle 的对象 obj 是类 Circle 的实例。
Method − A special kind of function that is defined in a class definition.
方法-在类定义中定义的一种特殊类型的函数。
Object − A unique instance of a data structure that's defined by its class. An object comprises both data members (class variables and instance variables) and methods.
对象-由其类定义的数据结构的唯一实例。对象包括数据成员(类变量和实例变量)和方法。
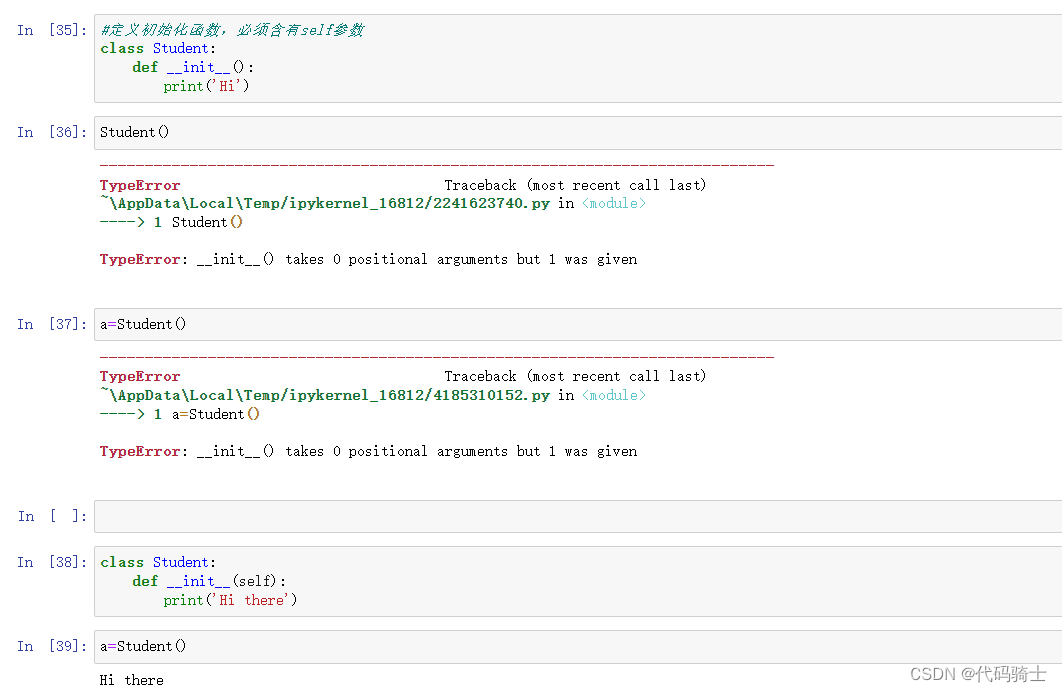
创建类并初始化
class Student:
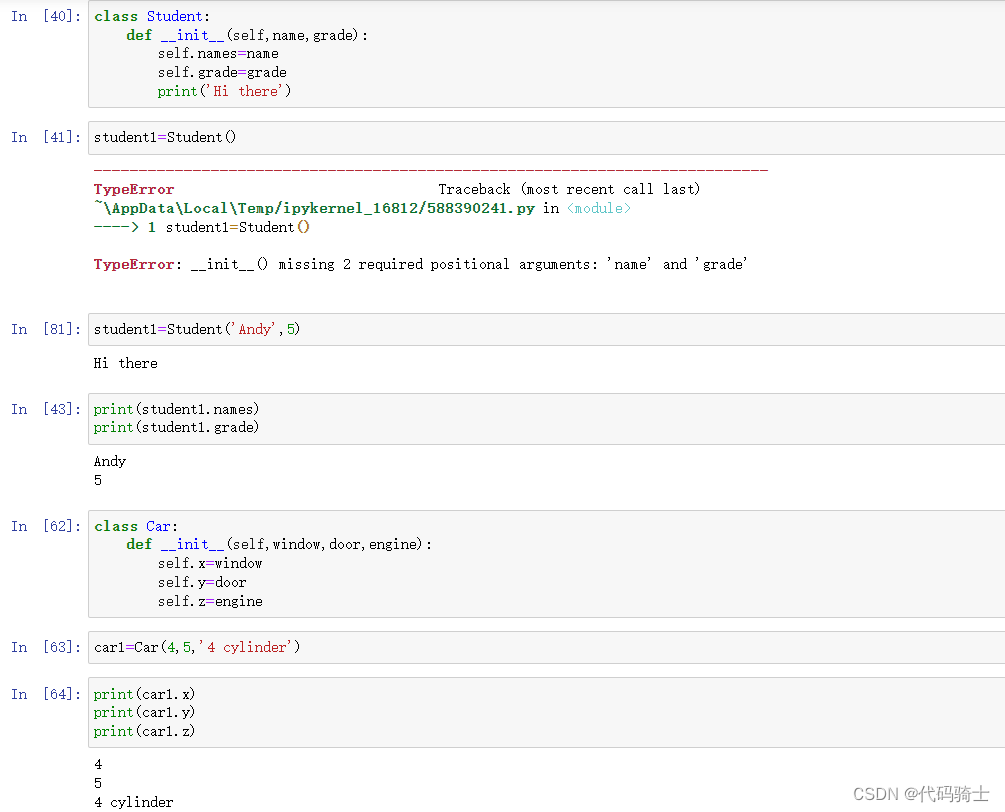
def __init__(self,name,grade):
self.names=name
self.grade=grade
print('Hi there')
student1=Student('Andy',5)
//Hi there
print(student1.names)
//Andy
print(student1.grade)
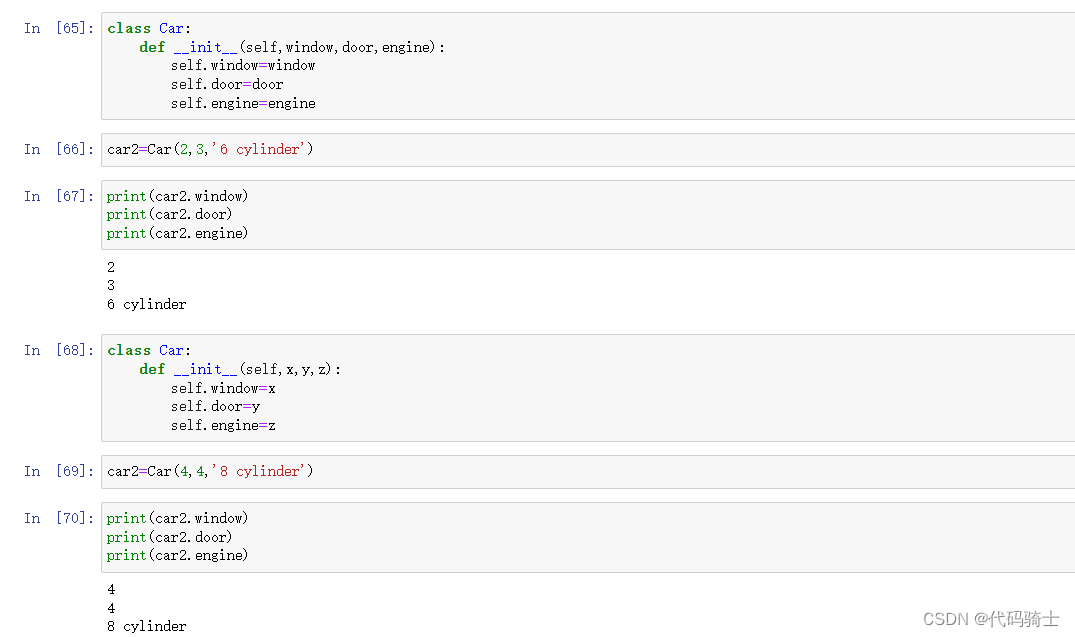
//5创建成员函数
#创建成员函数
class Car:
def __init__(self,window,door,engine):
self.window=window
self.door=door
self.engine=engine
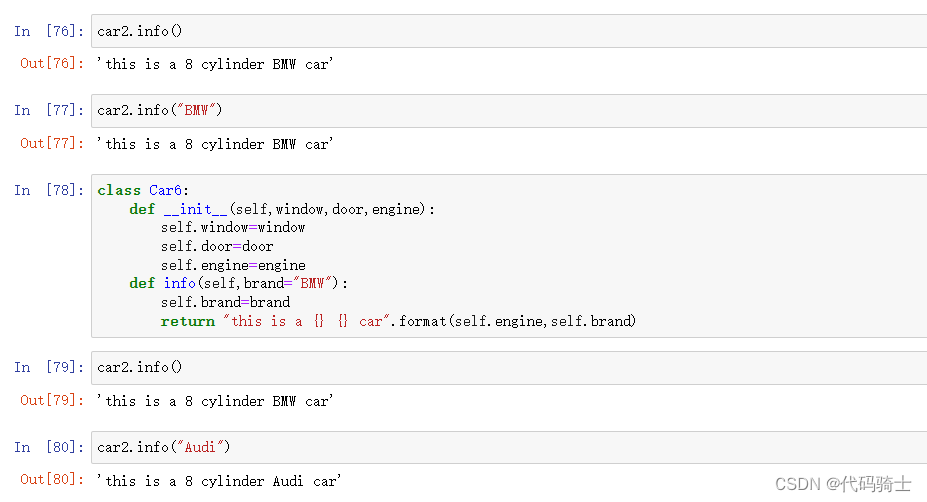
def info(self):
return "this is a {} car".format(self.engine)
car2.info()
//'this is a 8 cylinder BMW car'调用成员函数
class Car6:
    def __init__(self,window,door,engine):
        self.window=window
        self.door=door
        self.engine=engine
    def info(self,brand="BMW"):
        self.brand=brand
        return "this is a {} {} car".format(self.engine,self.brand)

car2.info()
//'this is a 8 cylinder BMW car'

car2.info("Audi")
//'this is a 8 cylinder Audi car'
演示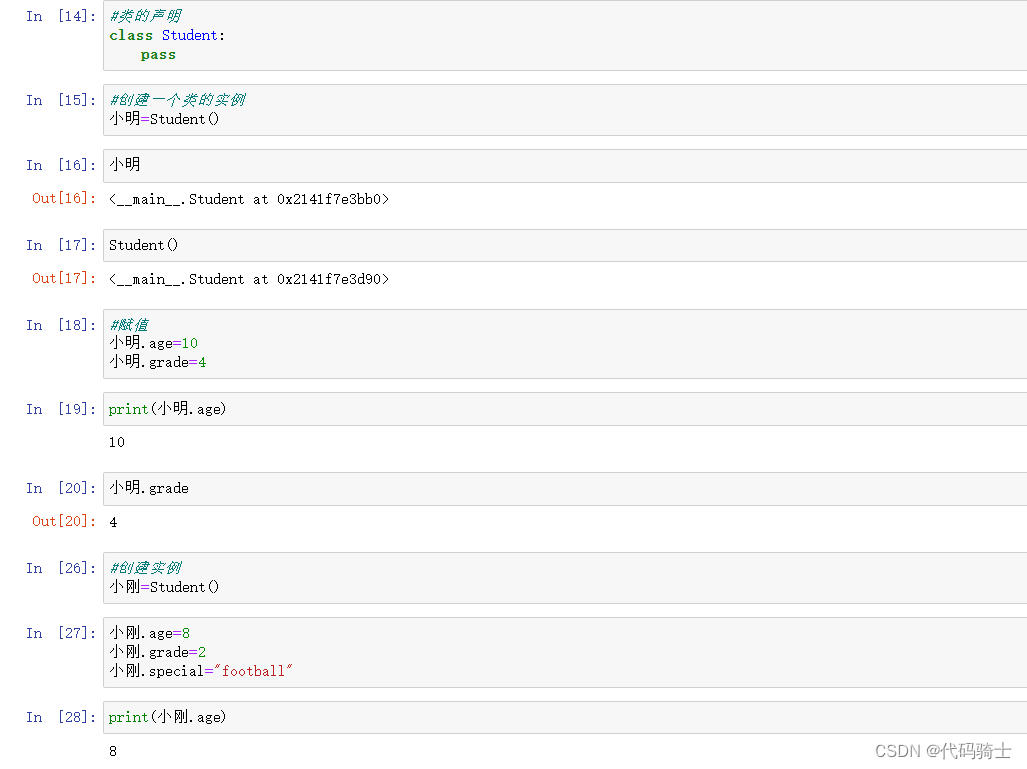
更多Python面向对象编程学习面向对象编程 - 廖雪峰的官方网站
P11-Univariate,Bivariate,MultiVariate Analysis & Histograms单变量,双变量,多变量分析及柱状图
数据加工/处理
常用函数
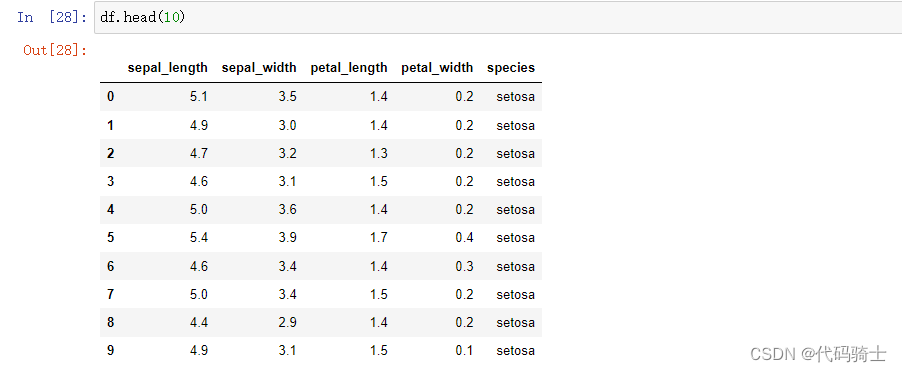
head()
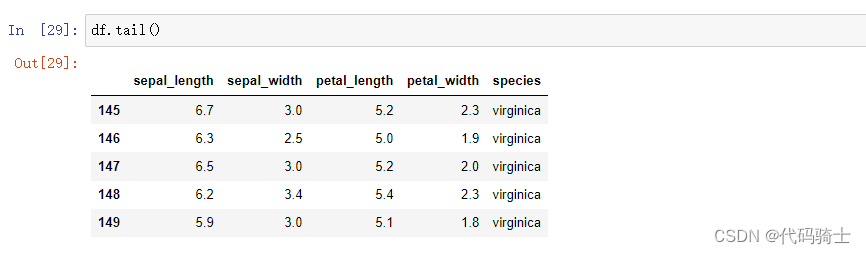
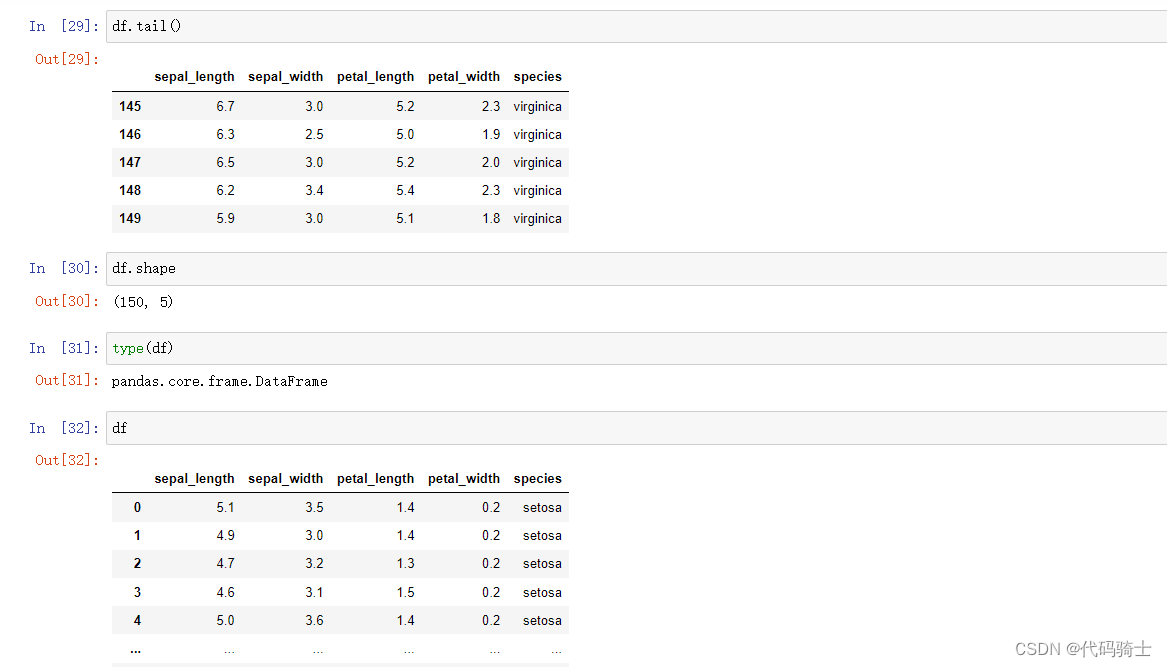
tail()
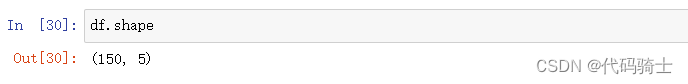
shape
type()
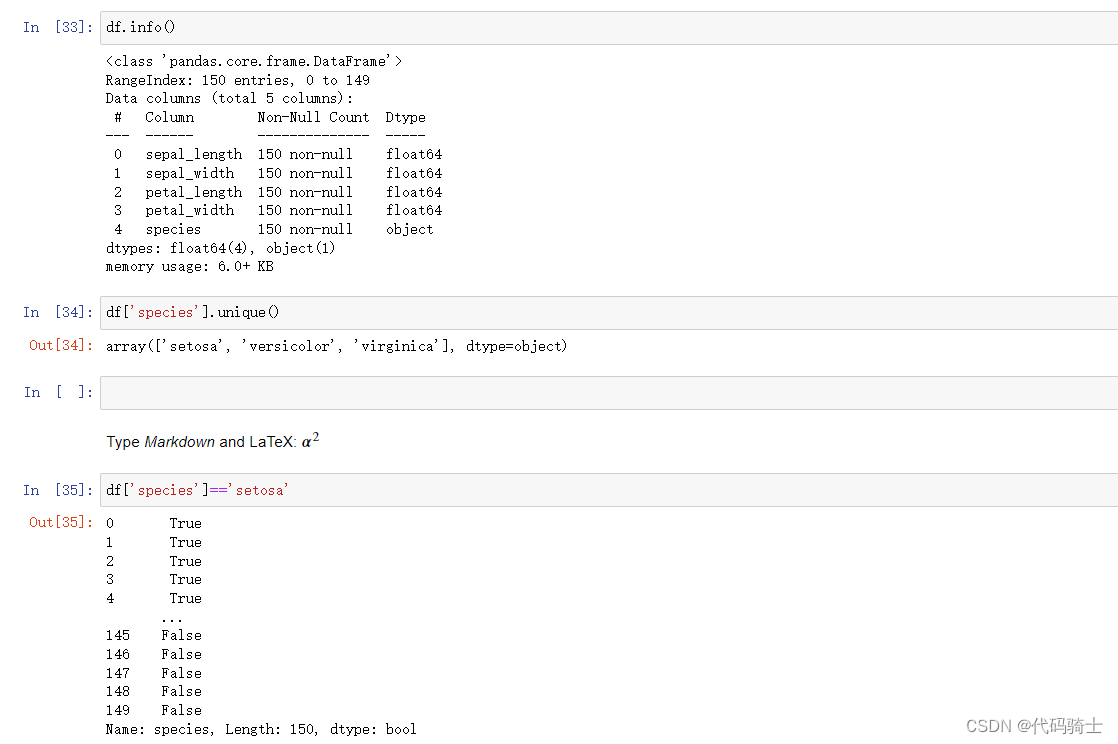
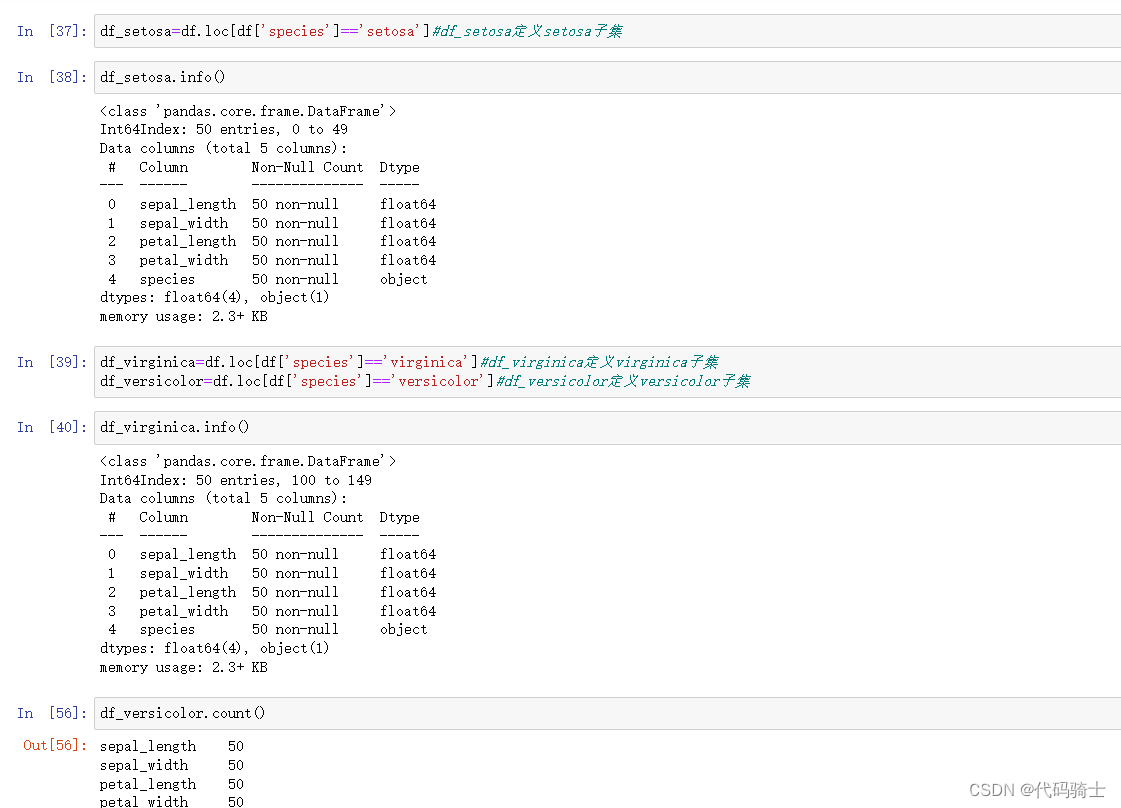
 info()
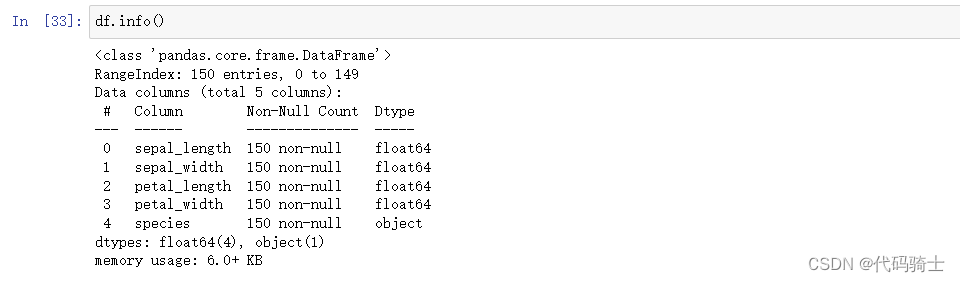
unique()

loc()&iloc()
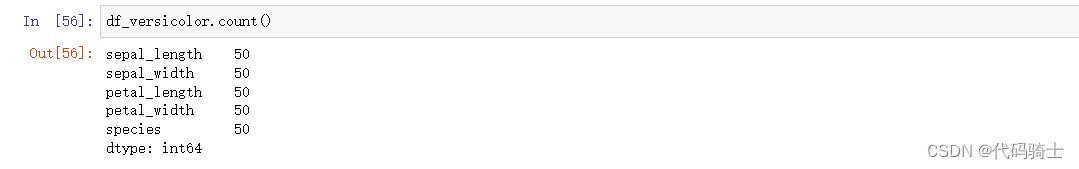
count()&value_counts()
测试代码
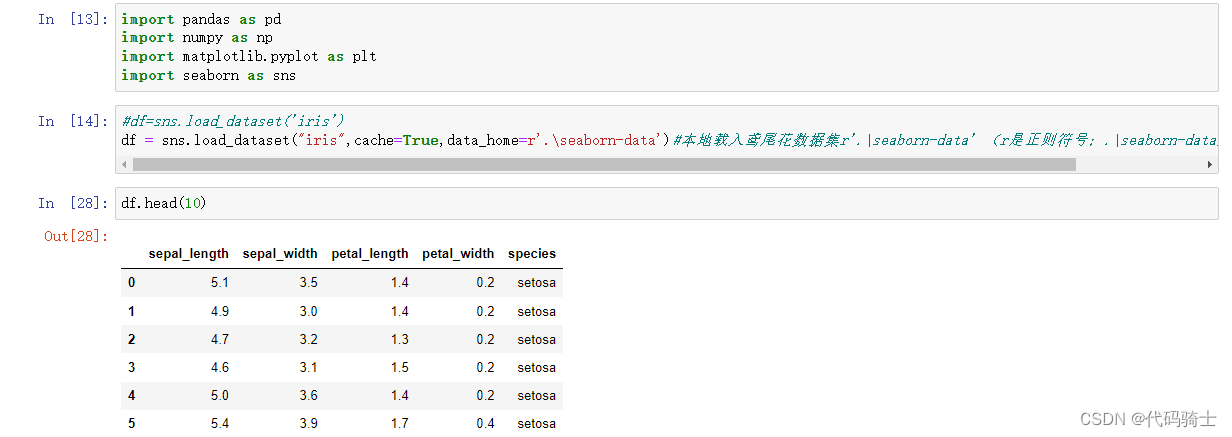
#导入函数库
import pandas as pd
import numpy as np
import matplotlib.pyplot as plt
import seaborn as sns
#离线加载数据集
#df=sns.load_dataset('iris')
df = sns.load_dataset("iris",cache=True,data_home=r'.\seaborn-data')#本地载入鸢尾花数据集r'.\seaborn-data' (r是正则符号;.\seaborn-data是文件的相对路径)
#划分三种不同子集
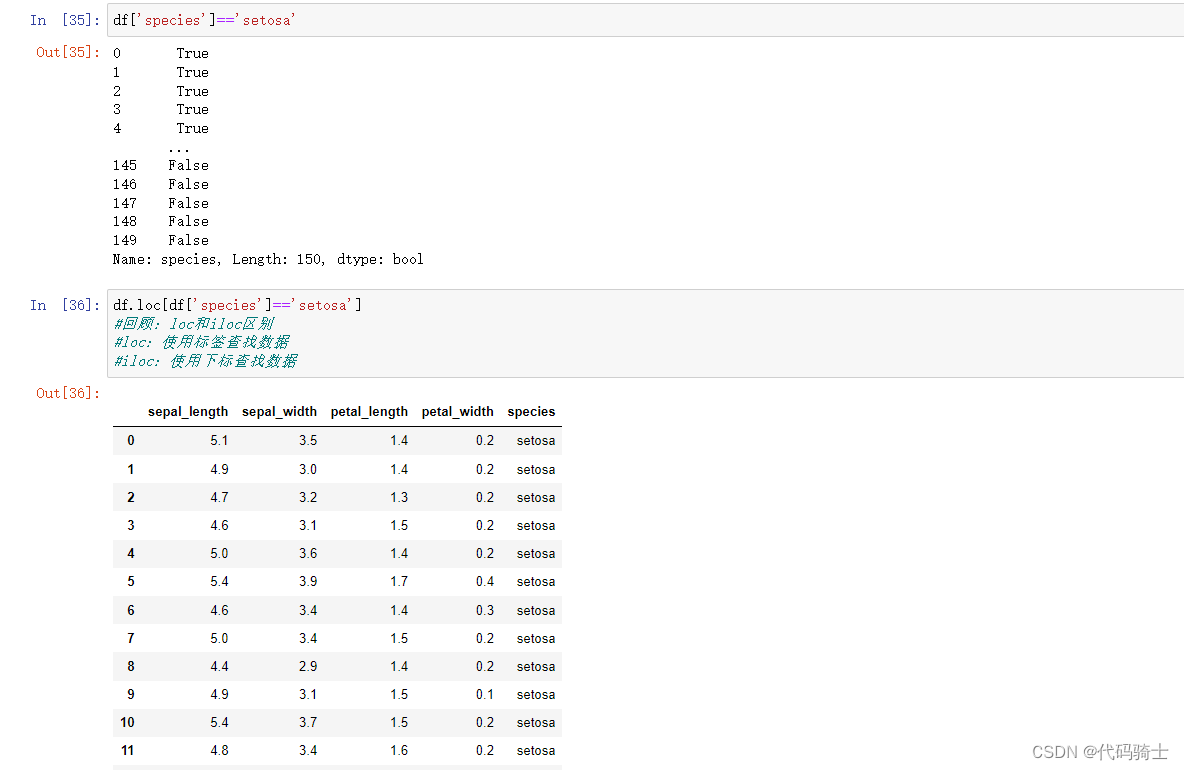
df_setosa=df.loc[df['species']=='setosa']#df_setosa定义setosa子集
df_virginica=df.loc[df['species']=='virginica']#df_virginica定义virginica子集
df_versicolor=df.loc[df['species']=='versicolor']#df_versicolor定义versicolor子集
演示
单变量分析
#单变量分析——花萼长度
plt.plot(df_setosa['sepal_length'])
plt.plot(df_virginica['sepal_length'])
plt.plot(df_versicolor['sepal_length'])
plt.ylabel('sepal_length')
plt.show()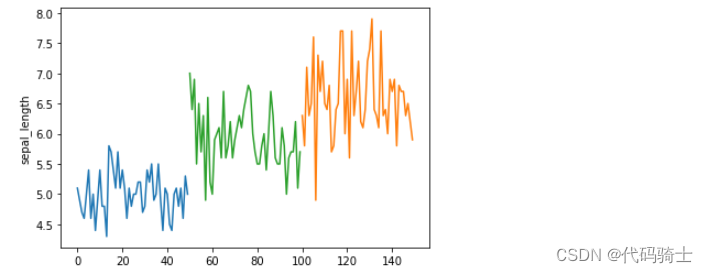
双引号与单引号有差别吗?In Python, such sequence of characters is included inside single or double quotes. As far as language syntax is concerned, there is no difference in single or double quoted string. Both representations can be used interchangeably. However, if either single or double quote is a part of the string itself, then the string must be placed in double or single quotes respectively. 在 Python 中,这样的字符序列包含在单引号或双引号中。就语言语法而言,单引号字符串和双引号字符串没有区别。这两种表示都可以互换使用。但是,如果单引号或双引号是字符串本身的一部分,那么字符串必须分别放在双引号或单引号中。
#单变量分析——花萼长度
plt.plot(df_setosa["sepal_length"],marker="x")
plt.plot(df_virginica['sepal_length'],marker='*')
plt.plot(df_versicolor['sepal_length'],marker='o')
plt.ylabel('sepal_length')
plt.show()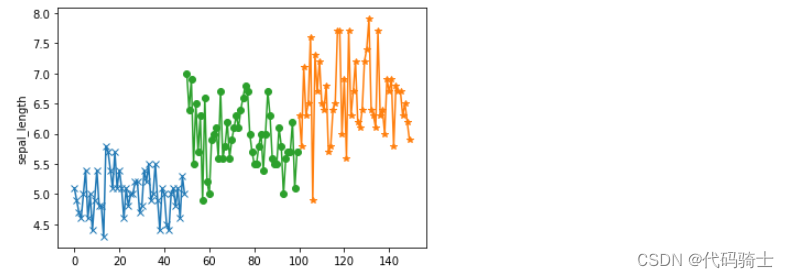
#单变量分析——花萼宽度
plt.plot(df_setosa['sepal_width'])
plt.plot(df_virginica['sepal_width'])
plt.plot(df_versicolor['sepal_width'])
plt.ylabel('sepal_width')
plt.show()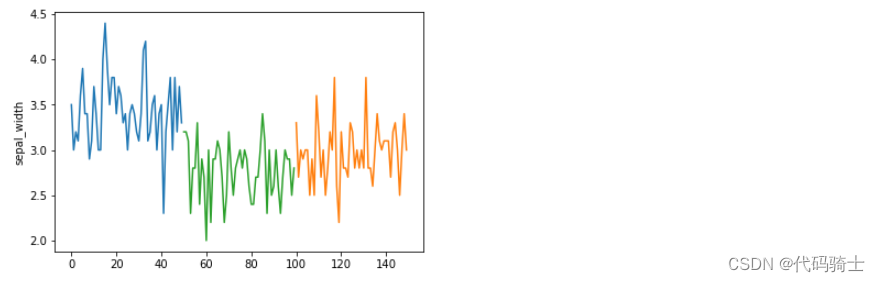
#单变量分析——花蕊长度
plt.plot(df_setosa['petal_length'])
plt.plot(df_virginica['petal_length'])
plt.plot(df_versicolor['petal_length'])
plt.ylabel('petal_length')
plt.show()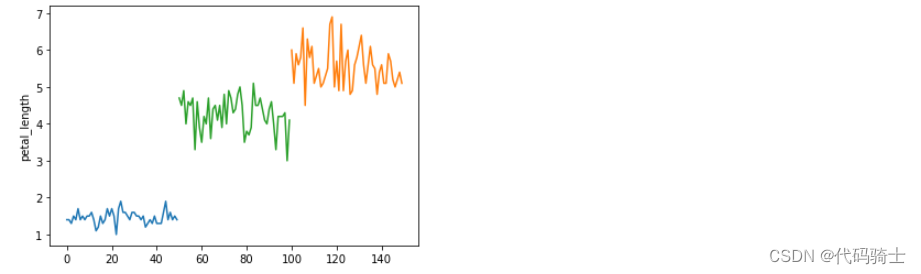
#单变量分析——花蕊长度
plt.plot(df_setosa['petal_width'])
plt.plot(df_virginica['petal_width'])
plt.plot(df_versicolor['petal_width'])
plt.ylabel('petal_width')
plt.show() 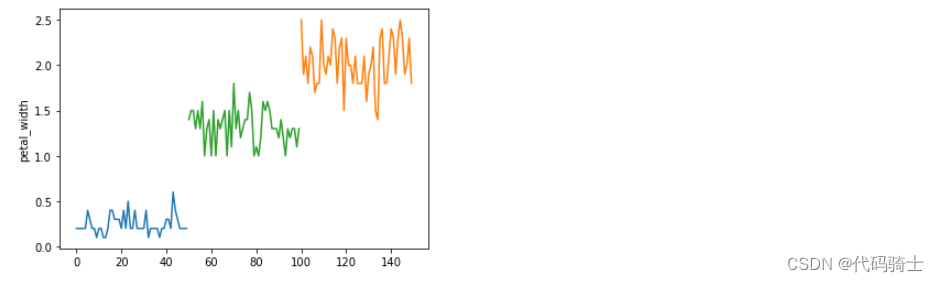
#单变量分析——花萼长度(自定义x、y轴)
plt.plot(df_setosa['species'],df_setosa['sepal_length'],marker='o')
plt.plot(df_virginica['species'],df_virginica['sepal_length'],marker='o')
plt.plot(df_versicolor['species'],df_versicolor['sepal_length'],marker='o')
plt.ylabel('sepal_length')
plt.show()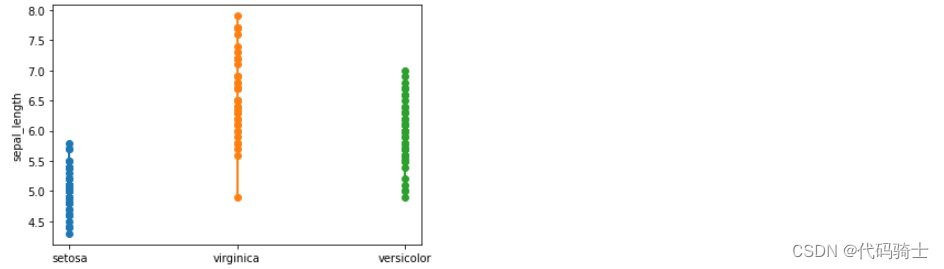
#单变量分析——花蕊宽度
plt.plot(df_setosa['petal_width'],df_setosa['species'],marker='o')
plt.plot(df_virginica['petal_width'],df_virginica['species'],marker='x')
plt.plot(df_versicolor['petal_width'],df_versicolor['species'],marker='*')
plt.xlabel('petal_width')
plt.show() 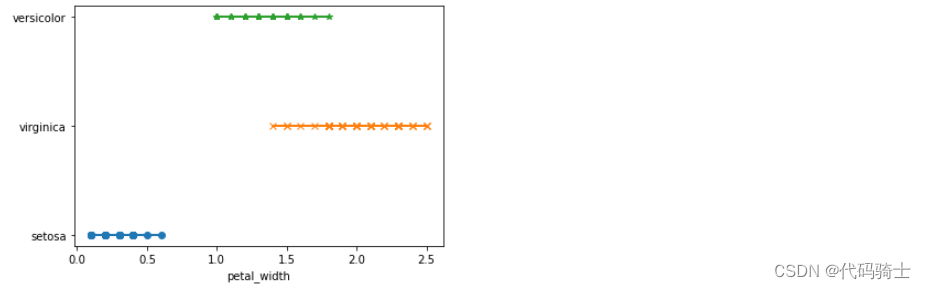
#np.zeros_like定义Y轴为0时比较

plt.plot(df_setosa['petal_length'],np.zeros_like(df_setosa['petal_length']),'o')
plt.plot(df_virginica['petal_length'],np.zeros_like(df_virginica['petal_length']),'x')
plt.plot(df_versicolor['petal_length'],np.zeros_like(df_versicolor['petal_length']),'*')
#plt.plot(df_setosa['sepal_length'],np.ones_like(df_setosa['sepal_length']),'o')
#plt.plot(df_virginica['sepal_length'],np.ones_like(df_virginica['sepal_length']),'x')
#plt.plot(df_versicolor['sepal_length'],np.ones_like(df_versicolor['sepal_length']),'*')
plt.xlabel('Petal length')
plt.show()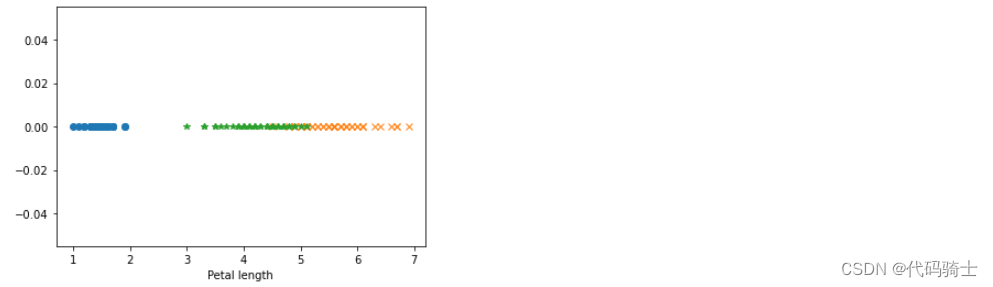
##np.zeros_like定义Y轴为1时比较
plt.plot(df_setosa['petal_length'],np.ones_like(df_setosa['petal_length']),'o')
plt.plot(df_virginica['petal_length'],np.ones_like(df_virginica['petal_length']),'x')
plt.plot(df_versicolor['petal_length'],np.ones_like(df_versicolor['petal_length']),'*')
#plt.plot(df_setosa['sepal_length'],np.ones_like(df_setosa['sepal_length']),'o')
#plt.plot(df_virginica['sepal_length'],np.ones_like(df_virginica['sepal_length']),'x')
#plt.plot(df_versicolor['sepal_length'],np.ones_like(df_versicolor['sepal_length']),'*')
plt.xlabel('Petal length')
plt.show()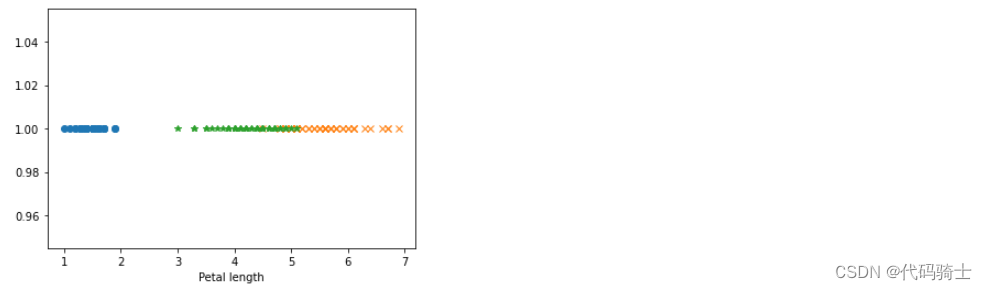
双变量分析
#X——花蕊长。Y——花蕊宽
#二元变量使得花更加立体,花萼的大小一目了然
plt.plot(df_setosa['petal_length'],df_setosa["petal_width"],'o')
plt.plot(df_virginica['petal_length'],df_virginica["petal_width"],'x')
plt.plot(df_versicolor['petal_length'],df_versicolor["petal_width"],'*')
plt.xlabel('Petal length')
plt.ylabel('petal_width')
plt.show()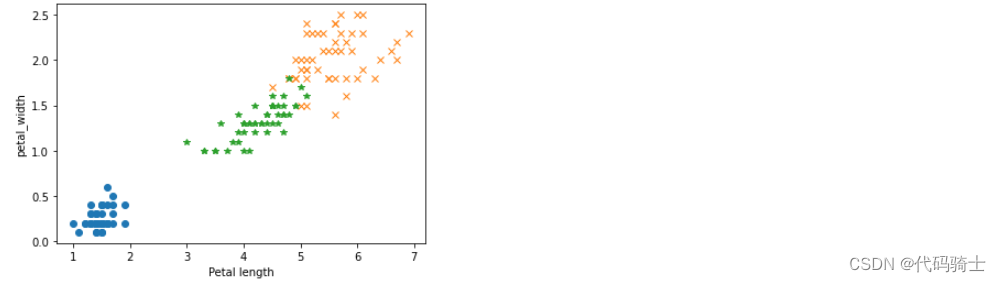
sns.FacetGrid(df,hue="species",height=7).map(plt.scatter,"petal_length","petal_width").add_legend()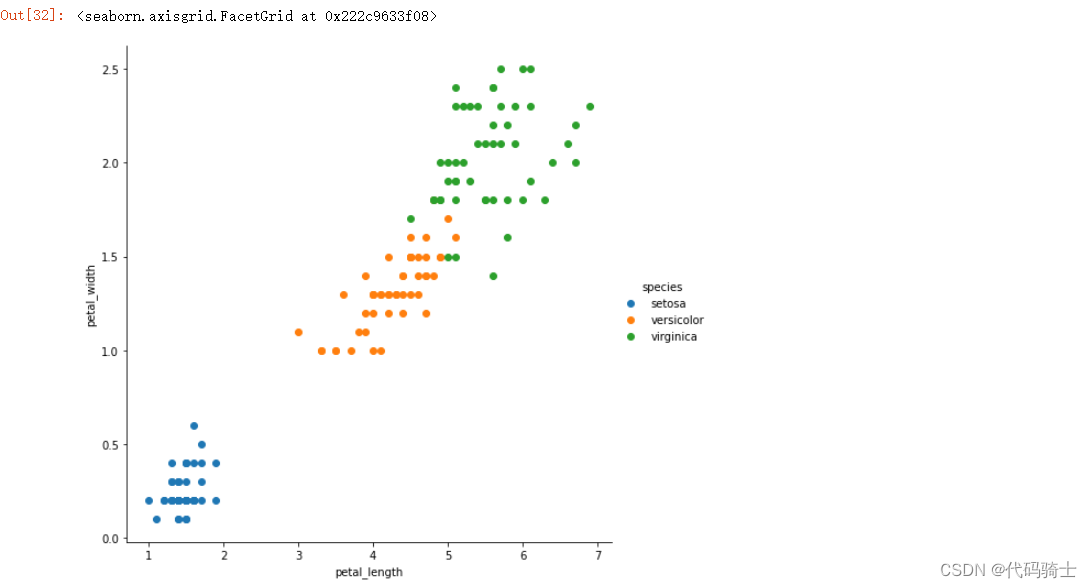
sns.FacetGrid(df,hue="species",height=5).map(plt.scatter,"petal_length","sepal_width").add_legend()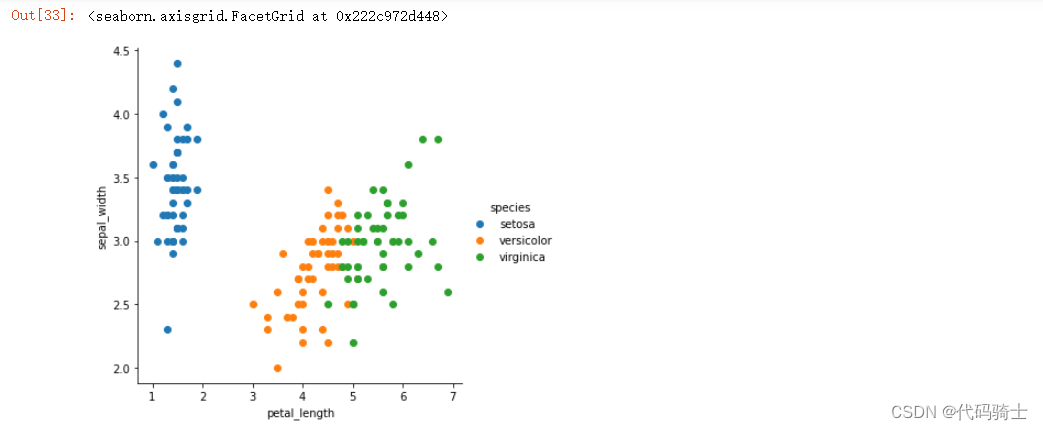
多变量分析
sns.pairplot(df,hue="species",height=3)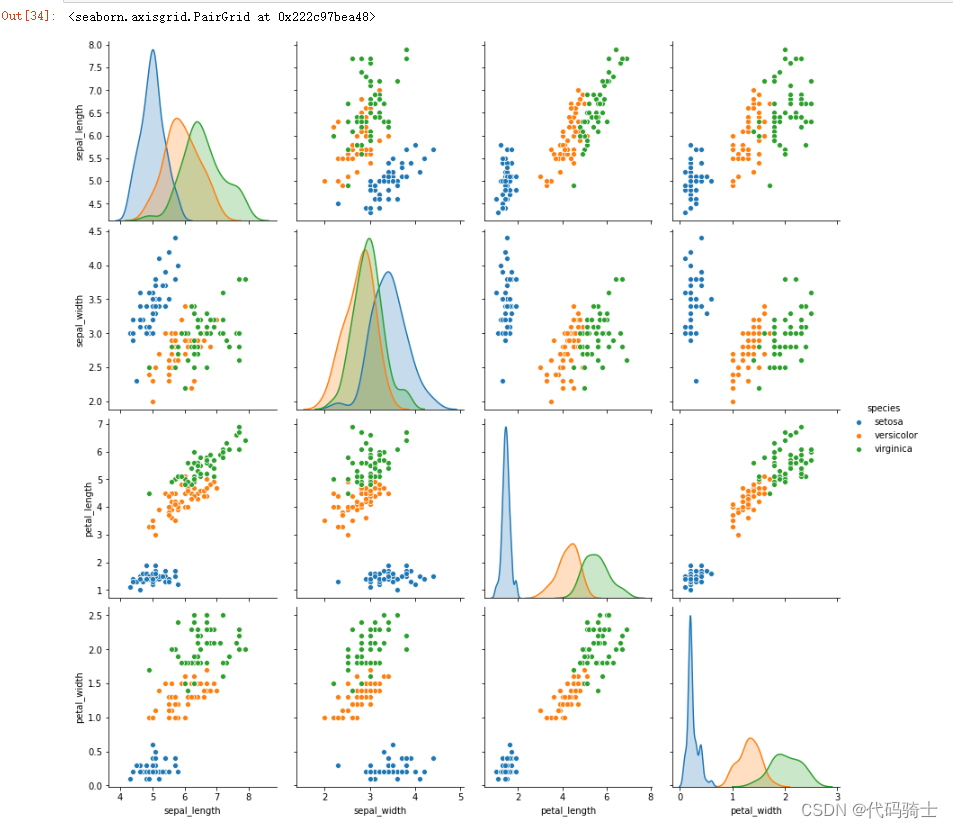
#相关性矩阵
df.corr() 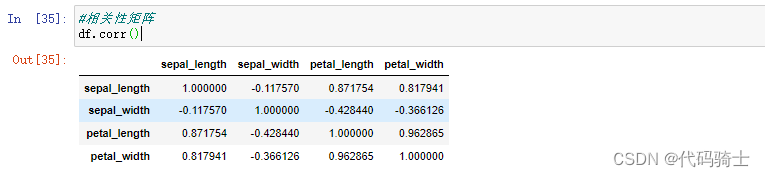
sns.heatmap(df.corr())#相关性热力图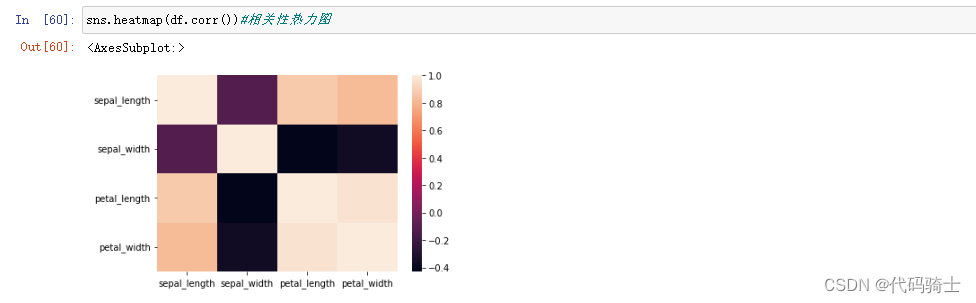
柱状图
plt.hist(df["petal_length"]) 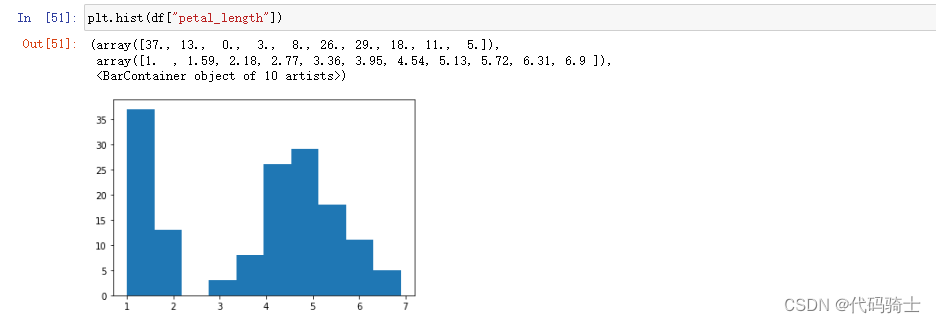
plt.hist(df_setosa["petal_length"])
plt.hist(df_virginica["petal_length"])
plt.hist(df_versicolor["petal_length"])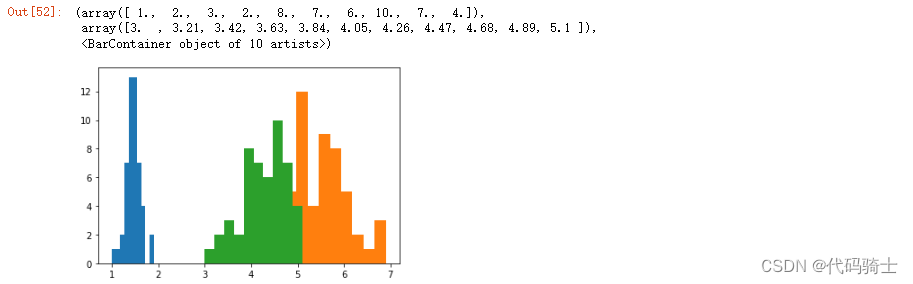
sns.distplot(df["petal_length"]) 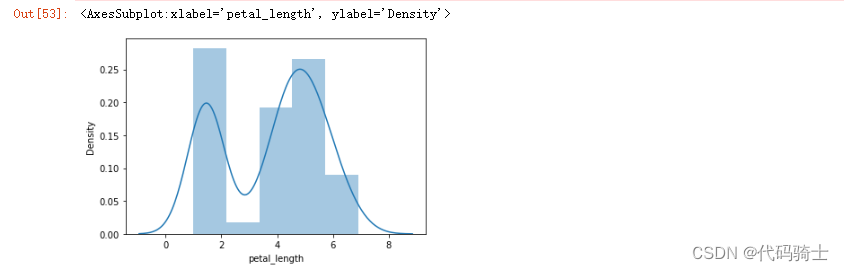
sns.distplot(df_setosa["petal_length"])
sns.distplot(df_virginica["petal_length"])
sns.distplot(df_versicolor["petal_length"])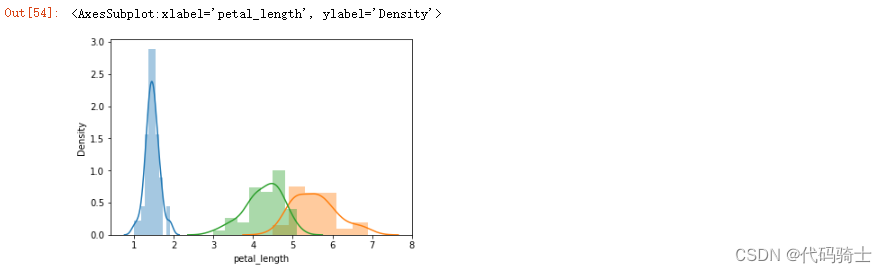
sns.distplot(df_versicolor["petal_length"])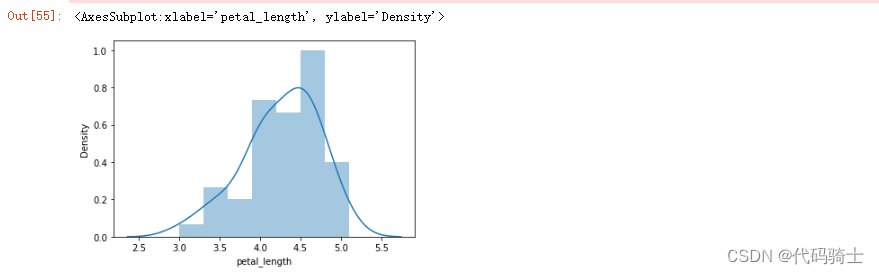
What Is a Bell Curve?
A bell curve is a common type of distribution for a variable, also known as the normal distribution. The term "bell curve" originates from the fact that the graph used to depict a normal distribution consists of a symmetrical bell-shaped curve. The highest point on the curve, or the top of the bell, represents the most probable event in a series of data (its mean, mode, and median in this case), while all other possible occurrences are symmetrically distributed around the mean, creating a downward-sloping curve on each side of the peak. The width of the bell curve is described by its standard deviation.
Normal distribution, also known as the Gaussian distribution, is a probability distribution that is symmetric about the mean, showing that data near the mean are more frequent in occurrence than data far from the mean. In graph form, normal distribution will appear as a bell curve.
正态分布(Normal distribution),也称“常态分布”,又名高斯分布(Gaussian distribution),最早由棣莫弗(Abraham de Moivre)在求二项分布的渐近公式中得到。C.F.高斯在研究测量误差时从另一个角度导出了它。P.S.拉普拉斯和高斯研究了它的性质。是一个在数学、物理及工程等领域都非常重要的概率分布,在统计学的许多方面有着重大的影响力。 正态曲线呈钟型,两头低,中间高,左右对称因其曲线呈钟形,因此人们又经常称之为钟形曲线。
零基础入门Python数据分析【Anaconda3-JupyterNotebook&seaborn版】学习初级阶段完成!

腾讯云面向开发者汇聚海量精品云计算使用和开发经验,营造开放的云计算技术生态圈。
更多推荐
 9
9 0
0- 0


 已为社区贡献7条内容

所有评论(0)