taro react 微信小程序中使用echarts
·
1、从echarts-for-weixin下载ec-canvas并放到src目录下
2、修改echarts.js文件,找到t.addEventListener(e,n,i)改为t.addEventListener?.(e,n,i),不然会报错t.addEventListener is not a function;
3、在你的页面的配置文件中(*.config.js),添加usingComponents:{“ec-canvas”: “…/…/ec-canvas/ec-canvas”},这里是为了在taro中使用微信小程序的原生组件(使用了后只能打包成微信小程序)
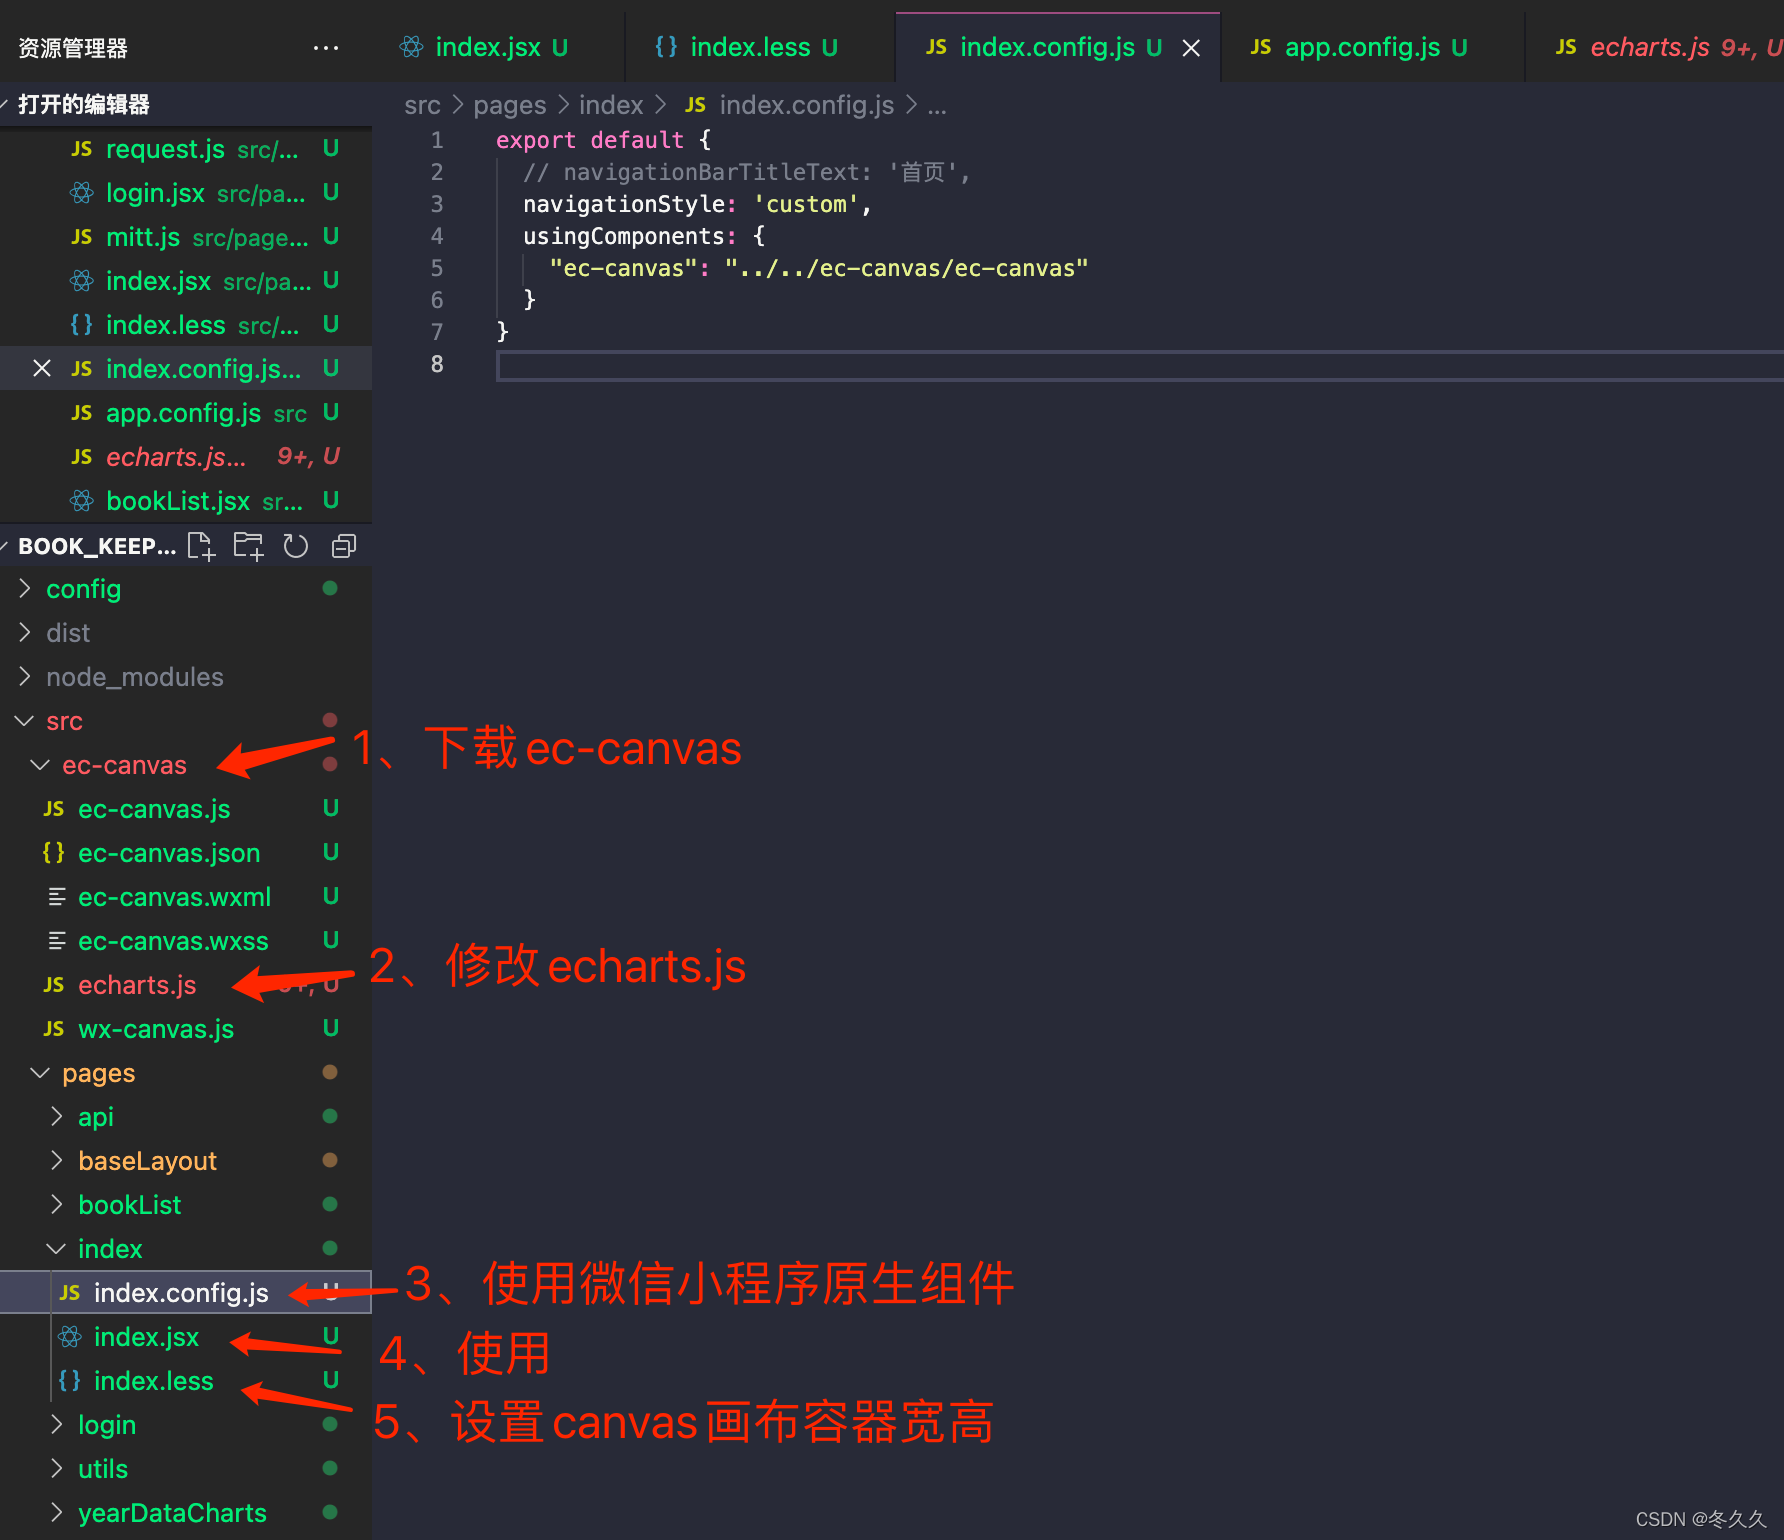
4、具体使用(index.jsx)
import { Component } from "react";
import { View } from "@tarojs/components";
import * as echarts from "../../ec-canvas/echarts";
import BaseLayout from '../baseLayout'
import './index.less'

// let pieDataA = null;
export default class Index extends Component {

  constructor(props) {
    super(props)
    this.state = {
      ec: {
        onInit: function (canvas, width, height) {
          const chart = echarts.init(canvas, null, {
            width: width,
            height: height
          });
          canvas.setChart(chart);
          const option = {
            title: {
              text: 'ECharts 入门示例'
            },
            tooltip: {},
            legend: {
              data: ['销量']
            },
            xAxis: {
              data: ['衬衫', '羊毛衫', '雪纺衫', '裤子', '高跟鞋', '袜子']
            },
            yAxis: {},
            series: [
              {
                name: '销量',
                type: 'bar',
                data: [5, 20, 36, 10, 10, 20]
              }
            ]
          };
          chart.setOption(option)
          return chart;
        }
      }
    }
  }
  render() {
    return (
      <BaseLayout>
        <View className='canvas-container'>
          <ec-canvas id='mychart-dom-bar' canvas-id='mychart-bar' ec={this.state.ec}></ec-canvas>
        </View>
      </BaseLayout>
    )
  }
}
5、css设置画布宽高
.canvas-container {
  width: 100%;
  height: 500px;
}
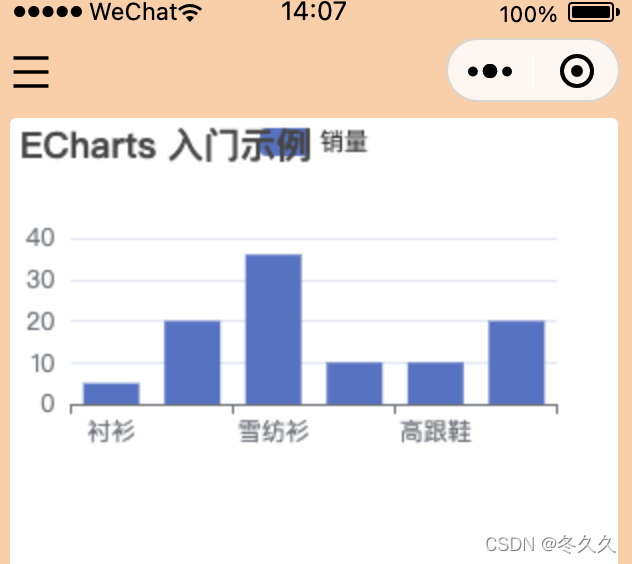
效果

腾讯云面向开发者汇聚海量精品云计算使用和开发经验,营造开放的云计算技术生态圈。
更多推荐
 11
11 0
0- 0


 已为社区贡献1条内容

所有评论(0)