基于Hive的天气情况大数据分析系统(通过hive进行大数据分析将分析的数据通过sqoop导入到mysql,通过Django基于mysql的数据做可视化
INSERT INTO TABLE top_cities_high_wind
SELECT
city,
COUNT(*) AS high_wind_days_count
FROM
etl_weather_data
WHERE
CAST(wind_speed AS INT) >= 3
GROUP BY
city
ORDER BY
high_wind_days_count DESC
LIMIT 10;
**基于sqoop将数据导入到mysql中**
sqoop export
–connect jdbc:mysql://192.168.138.1:3306/big_data
–username root --password ‘123456’
–table top_sunny_cities_sqoop
–export-dir /hive/warehouse/big_data.db/big_data.dbbig_data.db/top_sunny_cities
–input-fields-terminated-by ‘\001’
–input-lines-terminated-by ‘\n’;
sqoop export
–connect jdbc:mysql:// 192.168.138.1:3306/big_data
–username root --password 123456
–table monthly_max_temperature_difference
–export-dir /user/hive/warehouse/big_data.db/big_data.dbmonthly_max_temperature_difference
–input-fields-terminated-by ‘\001’
–input-lines-terminated-by ‘\n’
sqoop export
–connect jdbc:mysql:// 192.168.138.1:3306/big_data
–username root --password 123456
–table top_cities_high_wind
–export-dir /user/hive/warehouse/big_data.db/big_data.dbtop_cities_high_wind
–input-fields-terminated-by ‘\001’
–input-lines-terminated-by ‘\n’
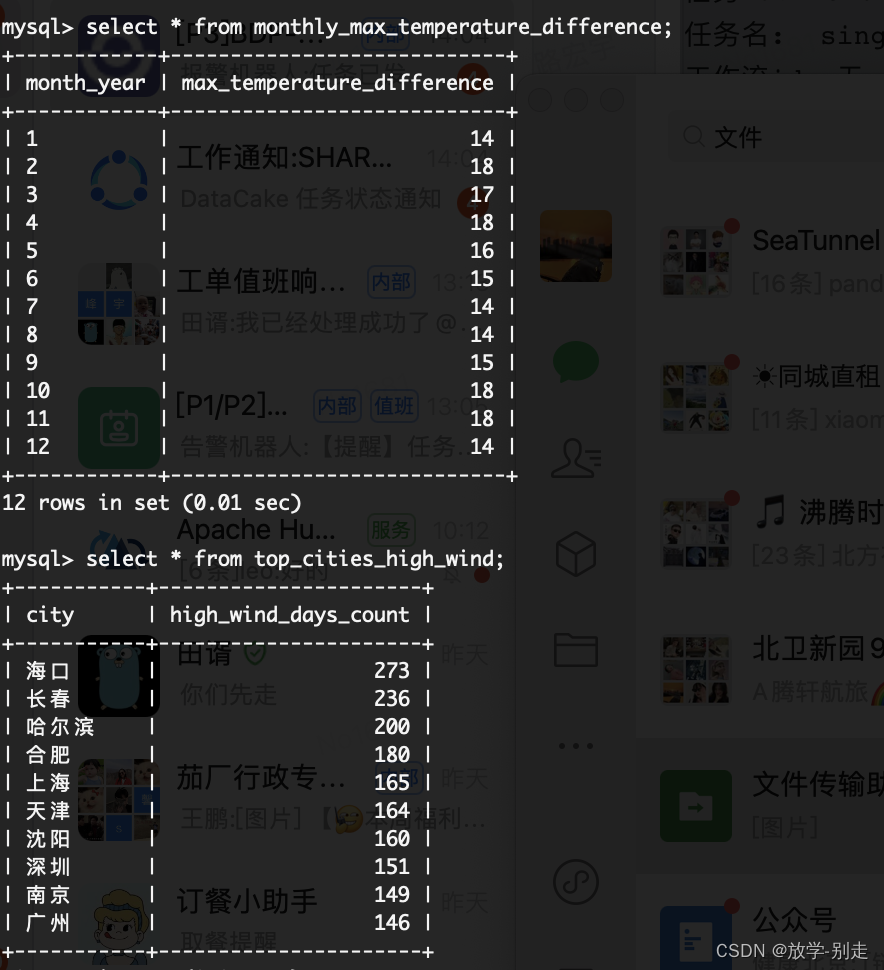
**基于mysql数据使用Django做数据可视化**
from django.contrib.auth.decorators import login_required
from django.http import HttpResponse
from django.shortcuts import render, redirect
from django.shortcuts import render
from pyecharts import options as opts
from pyecharts.charts import Line, Bar, Pie, Grid
Create your views here.
from django.shortcuts import render
from pyecharts.globals import ThemeType
from api.service.task_service import get_user, top_sunny_cities, monthly_max_temperature_difference,
top_cities_high_wind, top_rainy_cities, monthly_rainy_days, yearly_min_temperatures, daily_wind_speed,
daily_temperature_difference, register_user
def login_page(request):
if request.method == ‘POST’:
username = request.POST.get(‘username’)
password = request.POST.get(‘password’)
user = get_user(username,password)
if user is not None:
return redirect(‘home’)
else:
return render(request, ‘login.html’, {‘error_message’: ‘Invalid login credentials.’})
return render(request, 'login.html')
def register_view(request):
# 处理注册逻辑
if request.method == ‘GET’:
username = request.GET.get(‘username’)
password = request.GET.get(‘password’)
if username and password:
register_user(username,password)
return HttpResponse(“注册成功!”)
return render(request, ‘register.html’) # 使用你的注册模板路径
def home(request):
print(2)
return render(request, ‘home.html’)
def data_analysis(request, button_id):
return render(request, ‘data_analysis.html’, {‘button_id’: button_id})
def data_analysis(request, button_id):
# 根据按钮 ID 进行不同的处理
if button_id == 1:
    x,y = top\_sunny\_cities()
    line_chart = (
        Line()
        .add\_xaxis(xaxis_data=x)
        .add\_yaxis(series_name="晴天个数", y_axis=y)
        .set\_global\_opts(title_opts=opts.TitleOpts(title="一年中每个城市晴天个数的top10"))
    )
    chart_html = line_chart.render\_embed()
    button_name = "折线图"
elif button_id == 2:
    x,y = monthly\_max\_temperature\_difference()
    line_chart = (
        Line()
        .add\_xaxis(xaxis_data=x)
        .add\_yaxis(series_name="温差值", y_axis=y)
        .set\_global\_opts(title_opts=opts.TitleOpts(title="北京一年中每个月的温差变化"))
    )
    chart_html = line_chart.render\_embed()
    button_name = "折线图"
elif button_id == 3:
    x,y = top\_cities\_high\_wind()
    bar_chart = (
        Bar()
        .add\_xaxis(xaxis_data=x)
        .add\_yaxis(series_name="3级风速次数",y_axis=y)
        .set\_global\_opts(title_opts=opts.TitleOpts(title="出现3级以上风速的top10个城市"))
    )
    chart_html = bar_chart.render\_embed()
    button_name = "条形图"
elif button_id == 4:
    x, y = top\_rainy\_cities()
    bar_chart = (
        Bar()
        .add\_xaxis(xaxis_data=x)
        .add\_yaxis(series_name="雨天数量", y_axis=y)
        .set\_global\_opts(title_opts=opts.TitleOpts(title="多雨城市的top10"))
    )
    chart_html = bar_chart.render\_embed()
    button_name = "条形图"

elif button_id == 5:
    x, y = monthly\_rainy\_days()
    pie = Pie()
    pie.add("", list(zip(x, y)))
    pie.set\_global\_opts(title_opts={"text": "杭州每月雨天变化", "subtext": "2022年"},
                        legend_opts=opts.LegendOpts(orient="vertical", pos_right="right", pos_top="center"))
    chart_html = pie.render\_embed()
    button_name = "饼图"

elif button_id == 6:
    x, y = yearly\_min\_temperatures()
    line_chart = (
        Line()
        .add\_xaxis(xaxis_data=x)
        .add\_yaxis(series_name="温度", y_axis=y)
        .set\_global\_opts(title_opts=opts.TitleOpts(title="城市一年中最低的温度top10"))
    )
    chart_html = line_chart.render\_embed()
    button_name = "折线图"

elif button_id == 7:
    x,y=daily\_temperature\_difference()
    # 创建饼图
    pie = (
        Pie(init_opts=opts.InitOpts(width="800px", height="600px"))
        .add(
            series_name="南京10月份1~10号温差变化",
            data_pair=list(zip(x, y)),
            radius=["40%", "75%"],  # 设置内外半径,实现空心效果
            label_opts=opts.LabelOpts(is_show=True, position="inside"),
        )
        .set\_global\_opts(title_opts=opts.TitleOpts(title="南京10月份1~10号温差变化"),
                         legend_opts=opts.LegendOpts(orient="vertical", pos_right="right", pos_top="center"),
                         )
        .set\_series\_opts(  # 设置系列选项,调整 is_show 阈值
            label_opts=opts.LabelOpts(is_show=True)
        )
    )
    chart_html = pie.render\_embed()
    button_name = "饼图"

elif button_id == 8:
    x,y=daily\_wind\_speed()

    bar_chart = (
        Bar()
        .add\_xaxis(xaxis_data=x)
        .add\_yaxis(series_name="风速级别", y_axis=y)
        .set\_global\_opts(title_opts=opts.TitleOpts(title="南京10月份每天的风速变化"))
    )
    chart_html = bar_chart.render\_embed()
    button_name = "条形图"

return render(request, 'data\_analysis.html', {'chart\_html': chart_html, 'button\_name': button_name})
自我介绍一下,小编13年上海交大毕业,曾经在小公司待过,也去过华为、OPPO等大厂,18年进入阿里一直到现在。
深知大多数同学面临毕业设计项目选题时,很多人都会感到无从下手,尤其是对于计算机专业的学生来说,选择一个合适的题目尤为重要。因为毕业设计不仅是我们在大学四年学习的一个总结,更是展示自己能力的重要机会。
因此收集整理了一份《2024年计算机毕业设计项目大全》,初衷也很简单,就是希望能够帮助提高效率,同时减轻大家的负担。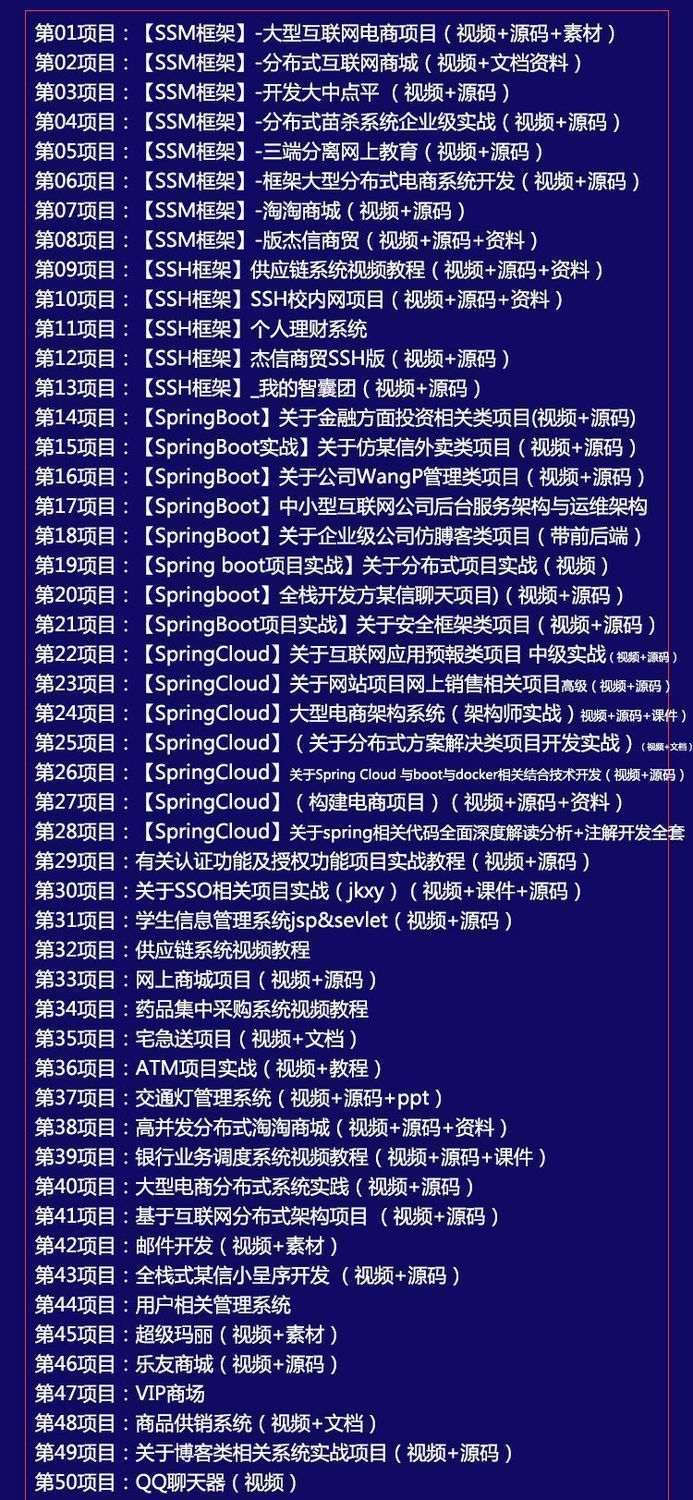
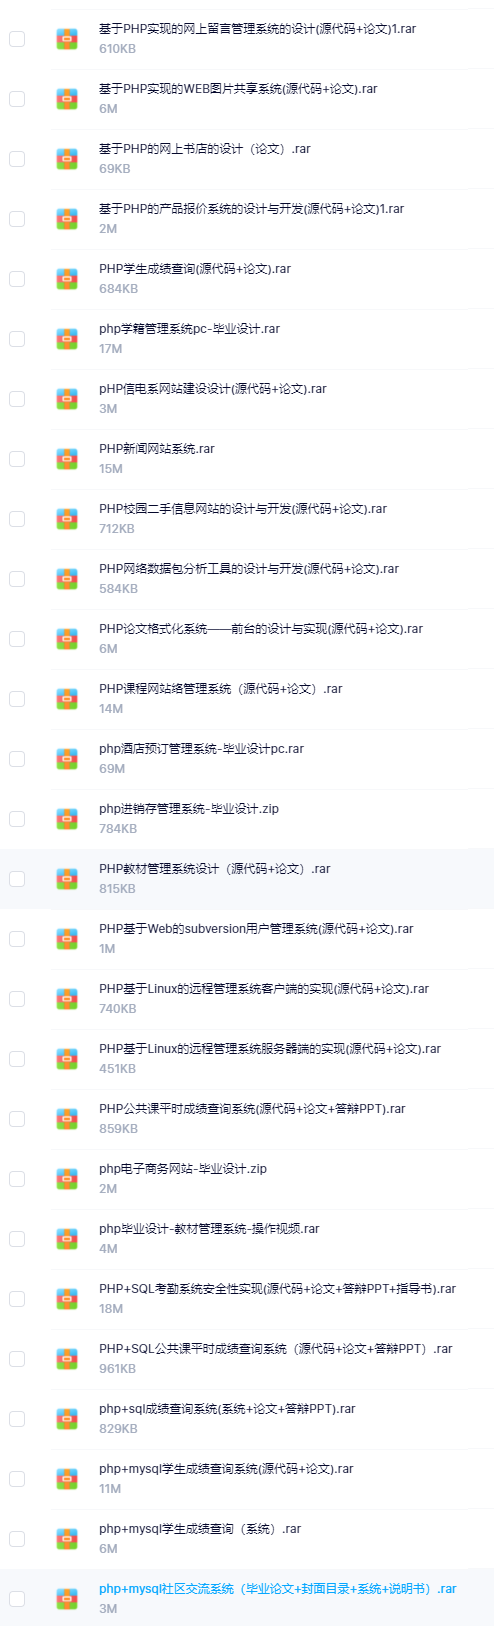
既有Java、Web、PHP、也有C、小程序、Python等项目供你选择,真正体系化!
由于项目比较多,这里只是将部分目录截图出来,每个节点里面都包含素材文档、项目源码、讲解视频
如果你觉得这些内容对你有帮助,可以添加VX:vip1024c (备注项目大全获取)
IoBj3-1712559365702)]
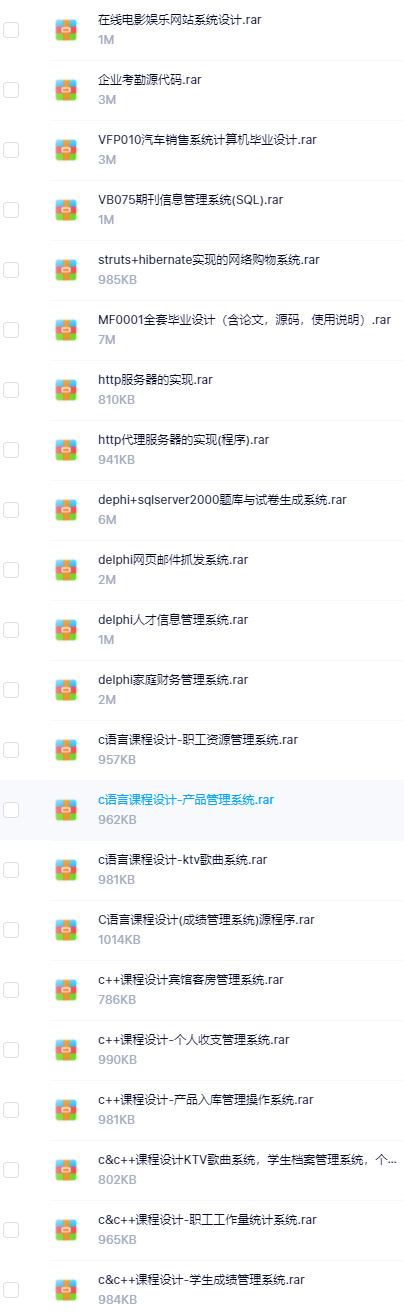
既有Java、Web、PHP、也有C、小程序、Python等项目供你选择,真正体系化!
由于项目比较多,这里只是将部分目录截图出来,每个节点里面都包含素材文档、项目源码、讲解视频
如果你觉得这些内容对你有帮助,可以添加VX:vip1024c (备注项目大全获取)
[外链图片转存中…(img-78w5SU6X-1712559365703)]

腾讯云面向开发者汇聚海量精品云计算使用和开发经验,营造开放的云计算技术生态圈。
更多推荐
 14
14 0
0- 0


 已为社区贡献6条内容

所有评论(0)