phpStorm && vscode 配置xdebug通用版
·
phpstudy 配置
- 配置的xdebug不局限是postman接口请求还是web请求同
- 我以phpstudy作为示例避免了单独去下载xdebug扩展
- php不限制首先需要需要开启xdebug扩展
- 到php的软件管理设置监听端口 避免使用9000端口 你懂的 端口自定义

- 最重要的一步就是去到对应的php.ini 设置xdebug.idekey 自定义后续在phpstorn环境中用的到 vscode可忽略
[Xdebug]
xdebug.idekey=debug    #重点关注
xdebug.remote_autostart = 1
zend_extension=C:/phpstudy_pro/Extensions/php/php7.2.9nts/ext/php_xdebug.dll
xdebug.collect_params=1
xdebug.collect_return=1
xdebug.auto_trace=On
xdebug.trace_output_dir=C:/phpstudy_pro/Extensions/php_log/php7.2.9nts.xdebug.trace
xdebug.profiler_enable=On
xdebug.profiler_output_dir=C:/phpstudy_pro/Extensions/php_log/php7.2.9nts.xdebug.profiler
xdebug.remote_enable=On
xdebug.remote_host=  127.0.0.1    #重点关注
xdebug.remote_port=9001   #重点关注
xdebug.remote_handler=dbgp
xdebug3.x版本
[Xdebug]
;debug 断点调试模式 profile开启性能分析 coverage开启代码覆盖率(与PHPUnit结合使用)trace开启跟踪
xdebug.mode=debug,profile
;yes 总是开启调试,无需显式触发 trigger仅在满足特定条件(触发条件)时启用调试 no禁用调试功能
;trigger模式带上参数为调试?XDEBUG_TRIGGER=PHPSTORM
xdebug.start_with_request=trigger
xdebug.client_host=192.168.3.126
xdebug.idekey=PHPSTORM
xdebug.client_port=9003
;debug 开启调试
xdebug.log =/var/log/php/xdebug.log
;trace 开启跟踪
;xdebug.trace_output_dir=/var/log/php/traces
;remote 开启远程调试
;xdebug.remote_log=/var/log/php/xdebug_remote.log
;profile 开启性能分析
xdebug.output_dir=/var/log/php/xdebug_output
phpstorm 配置
-
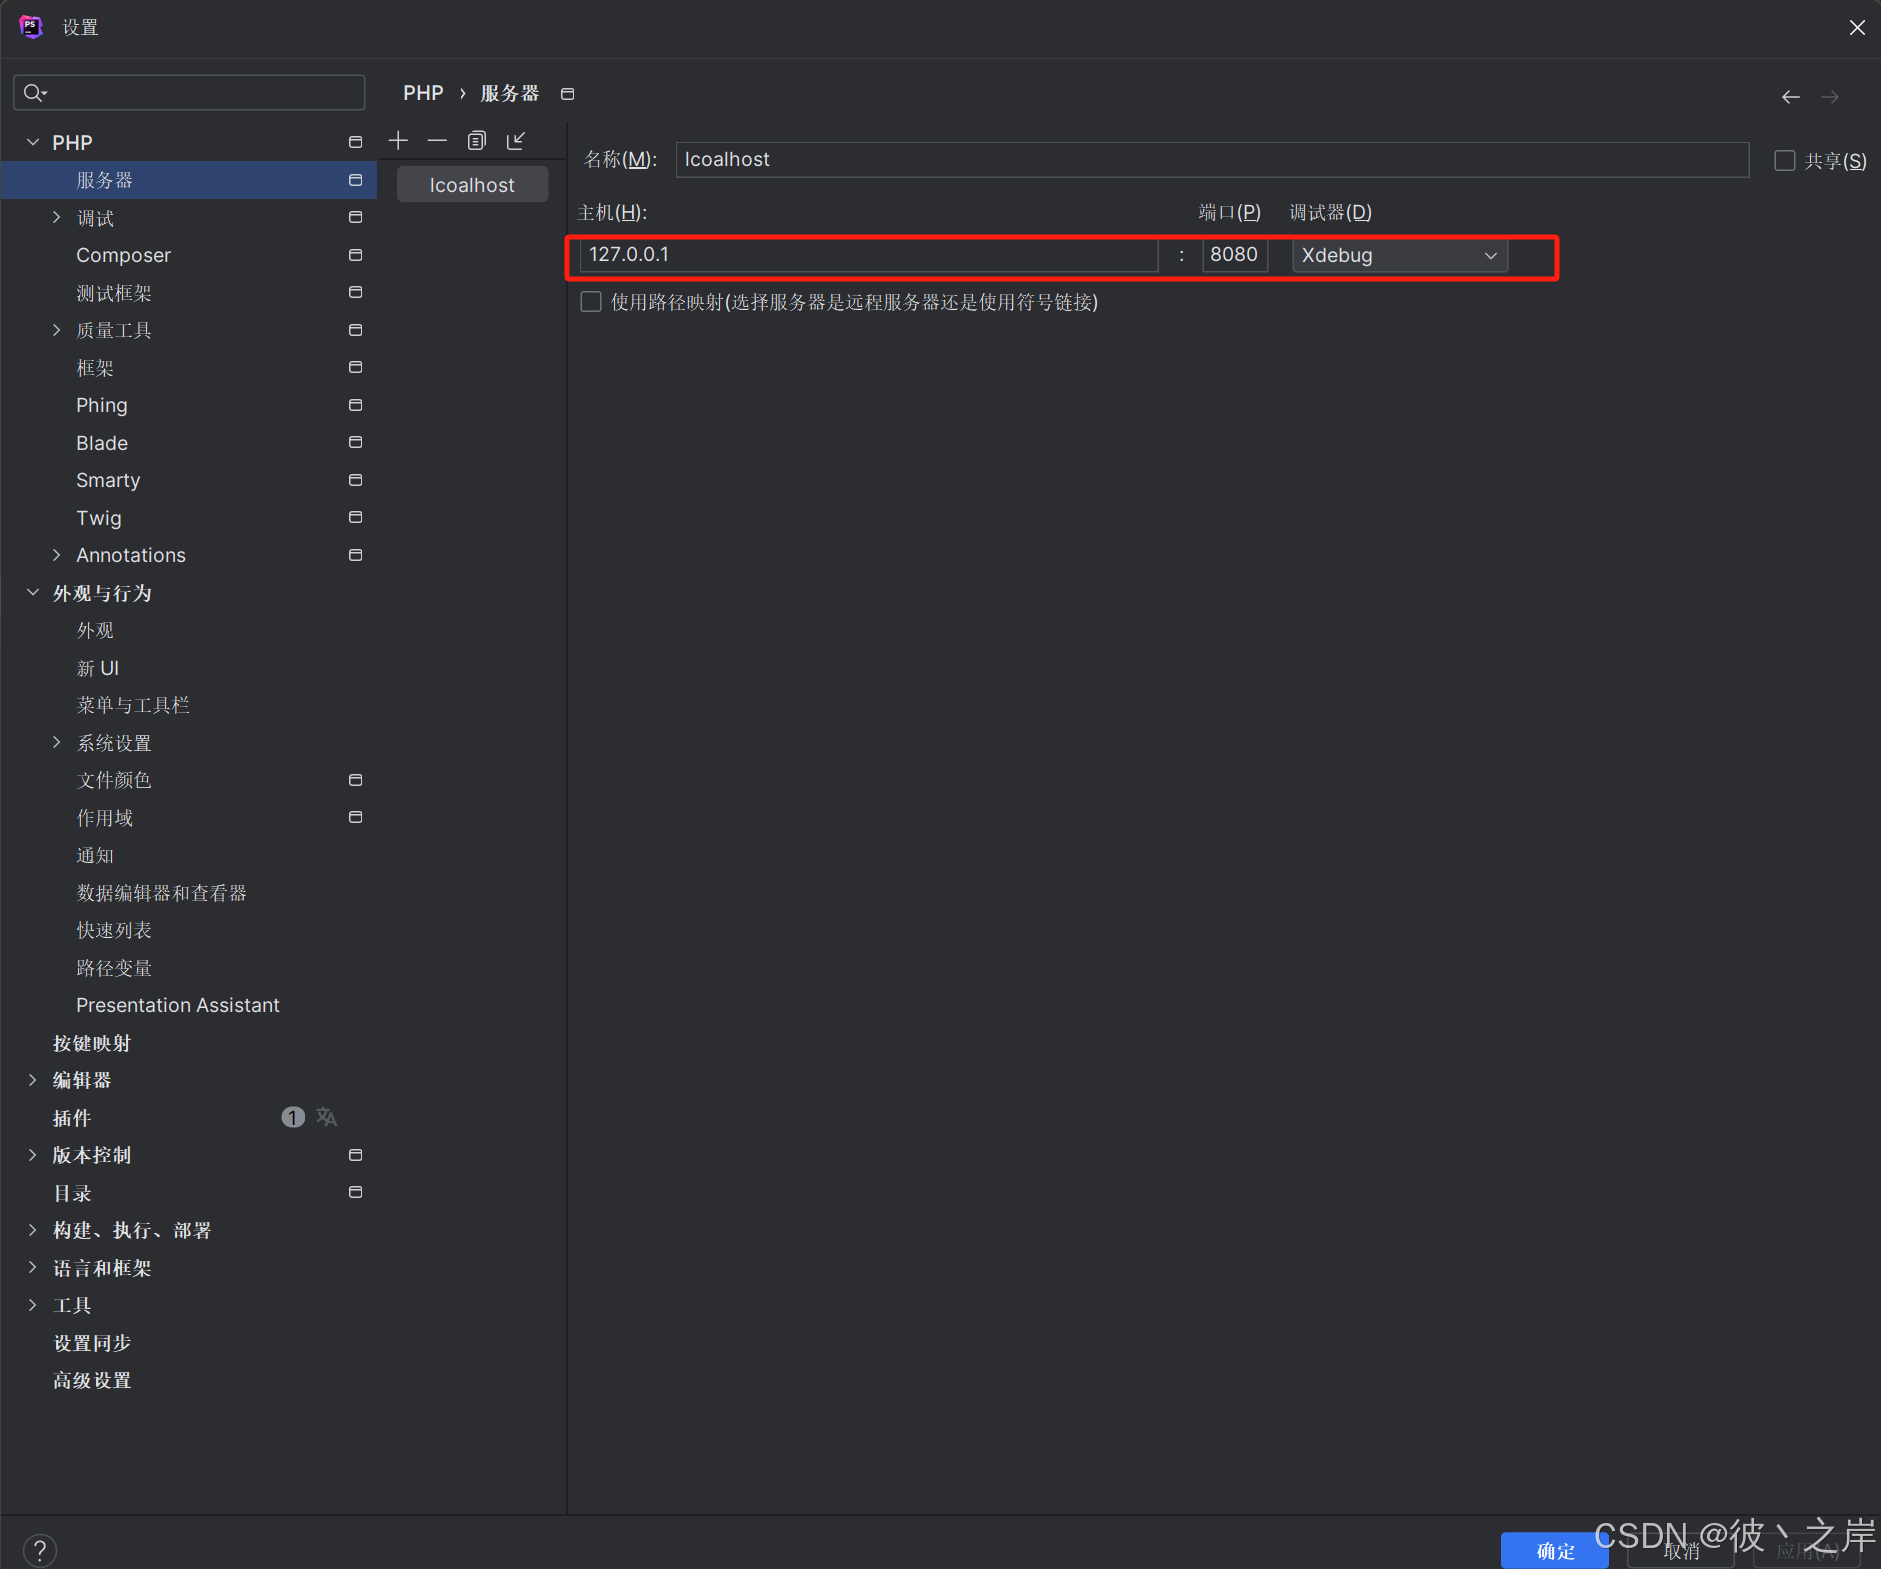
配置Servers。在 “Settings” 对话框中,选择 “PHP” ----> “Servers” 选项,创建本地调试服务器
-
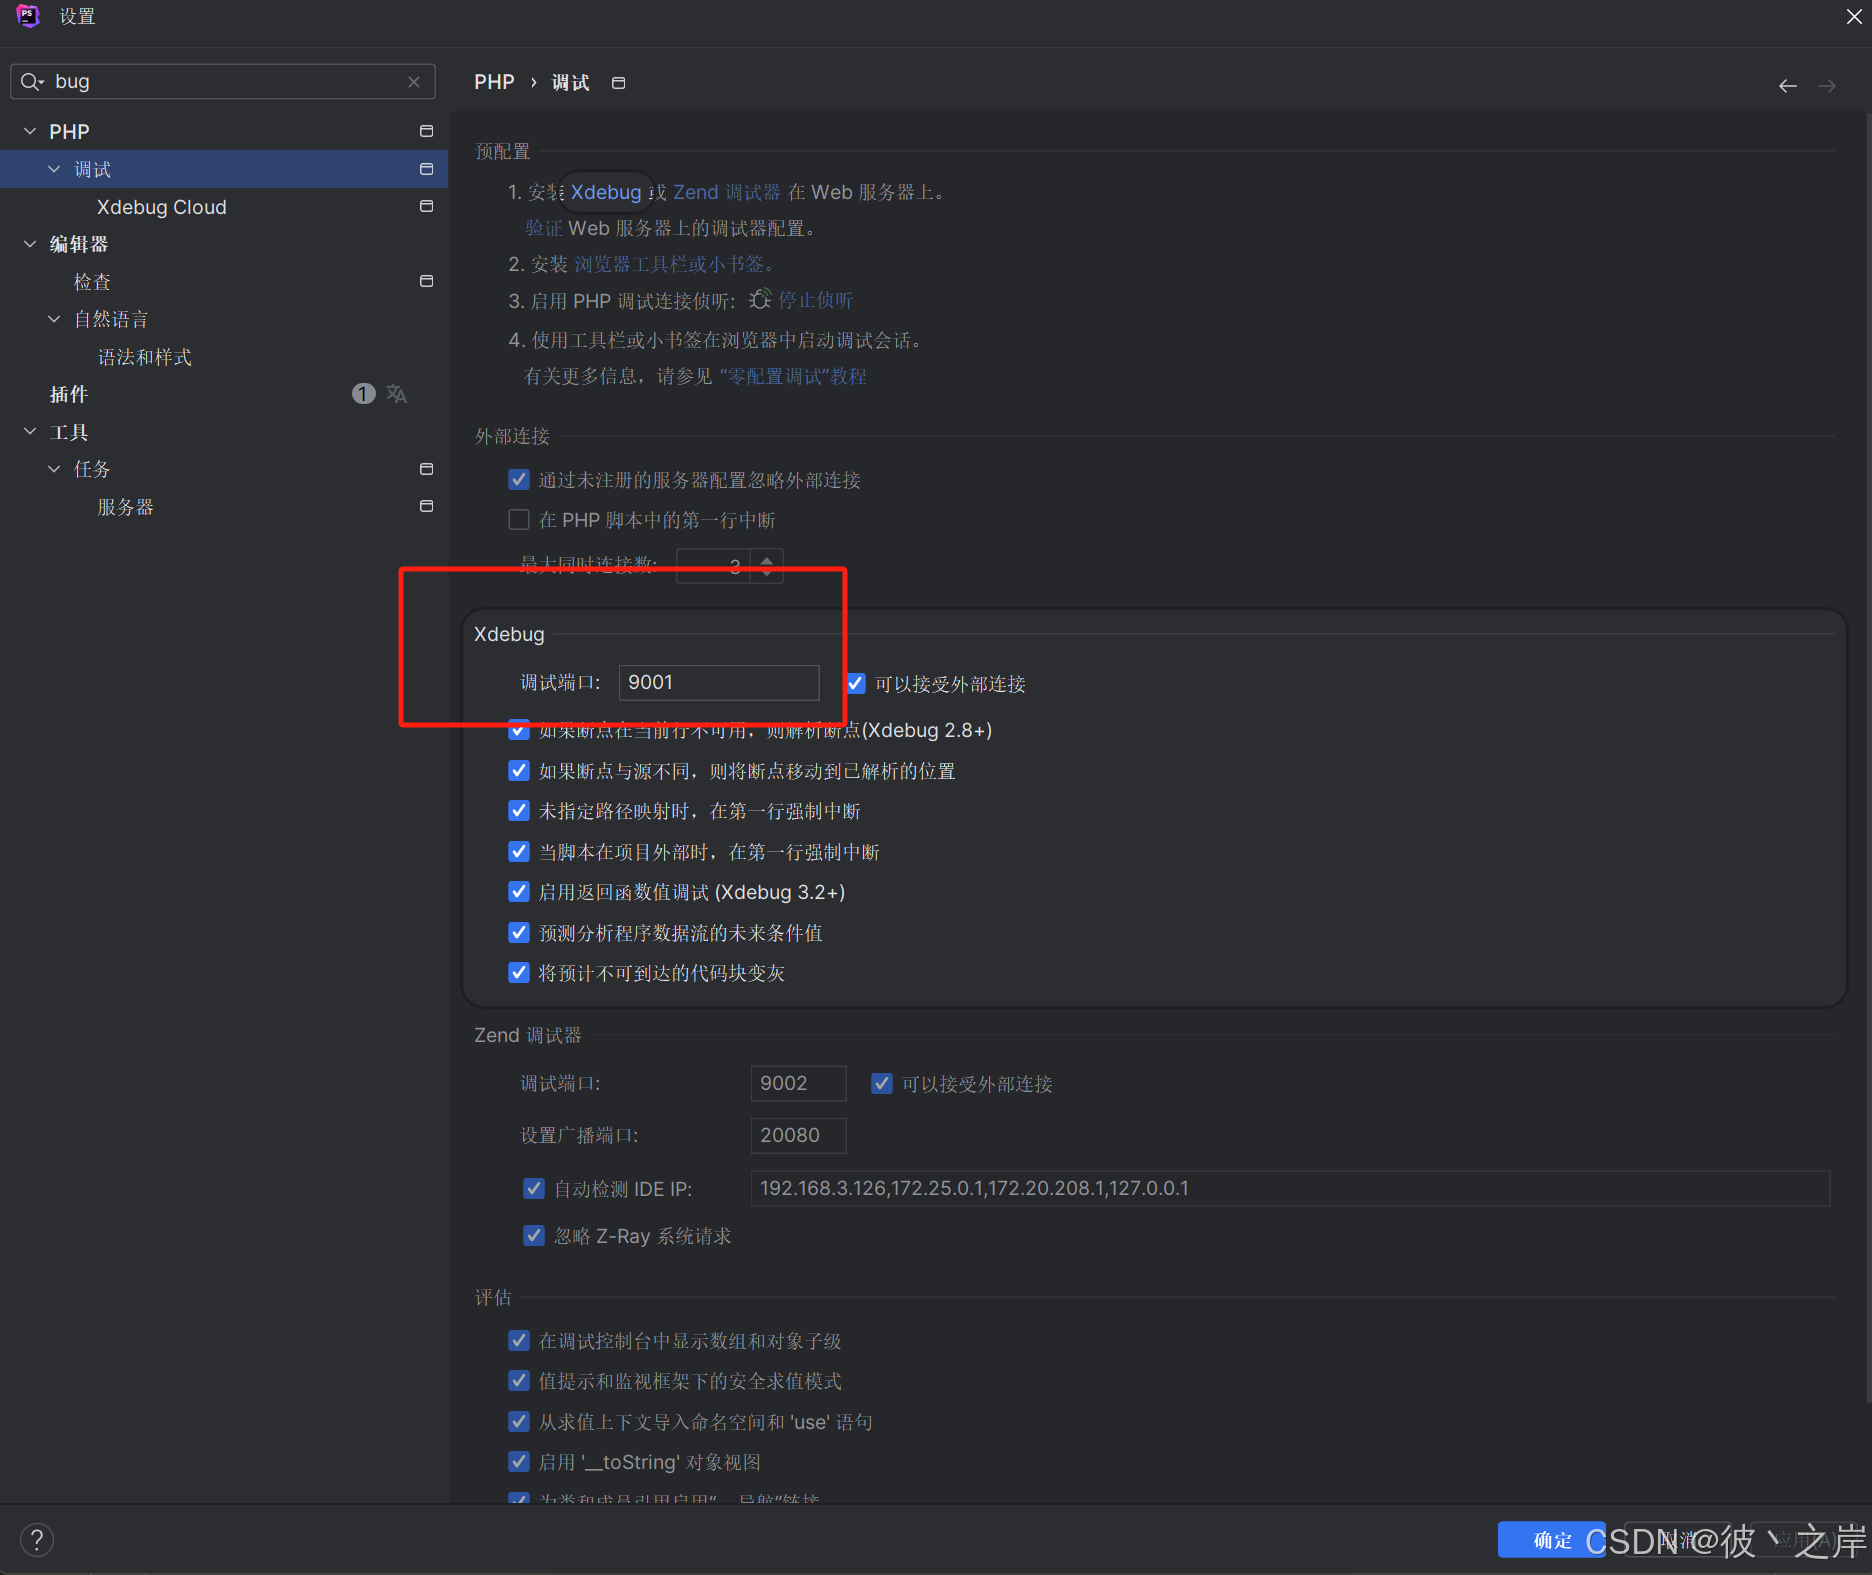
设置Xdebug端口。选择 “File” -----> “Settings” 命令,打开“Setting”对话框,选择 “Languages & Frameworks” -----> “PHP” ----->“Debug” 选项,如下图所示,将端口修改为9001(和上面 php.ini 中配置的xdebug.remote_port = 9001 保持一致即可)
-
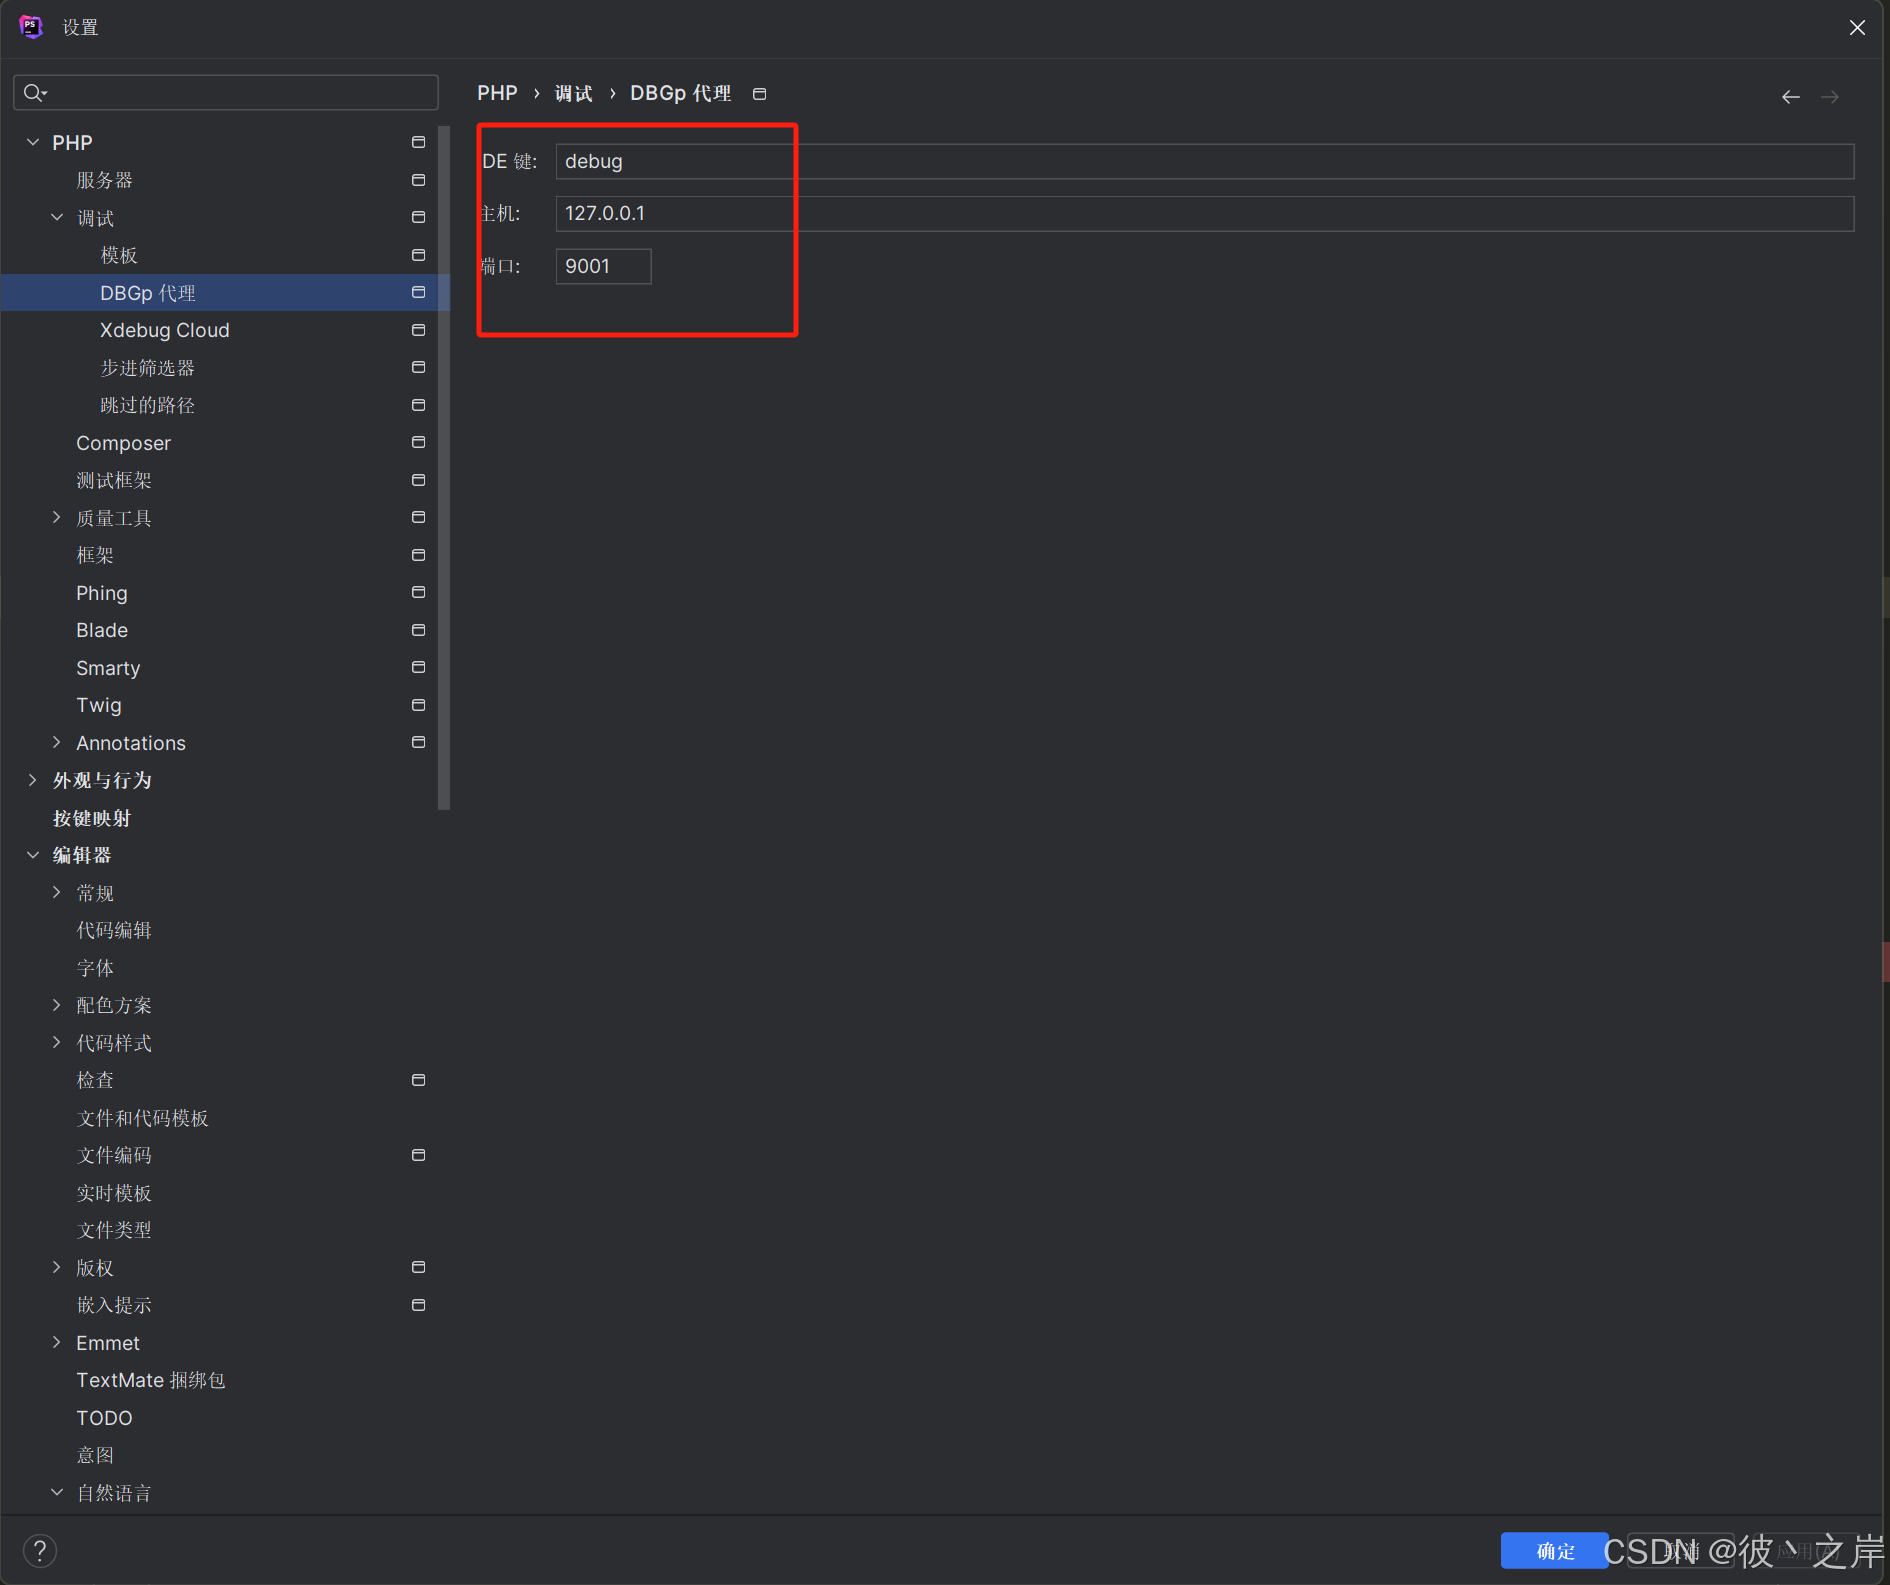
配置DBGp Proxy。在 “Settings” 对话框中,选择 “PHP” ----> “Debug” ----> “DBGp Proxy” 选项,在对话框中填写 “IDE Key” (和xdebug.idekey=debug保持一致)和 “Host” (和xdebug.remote_host = 127.0.0.1 保持一致)
-
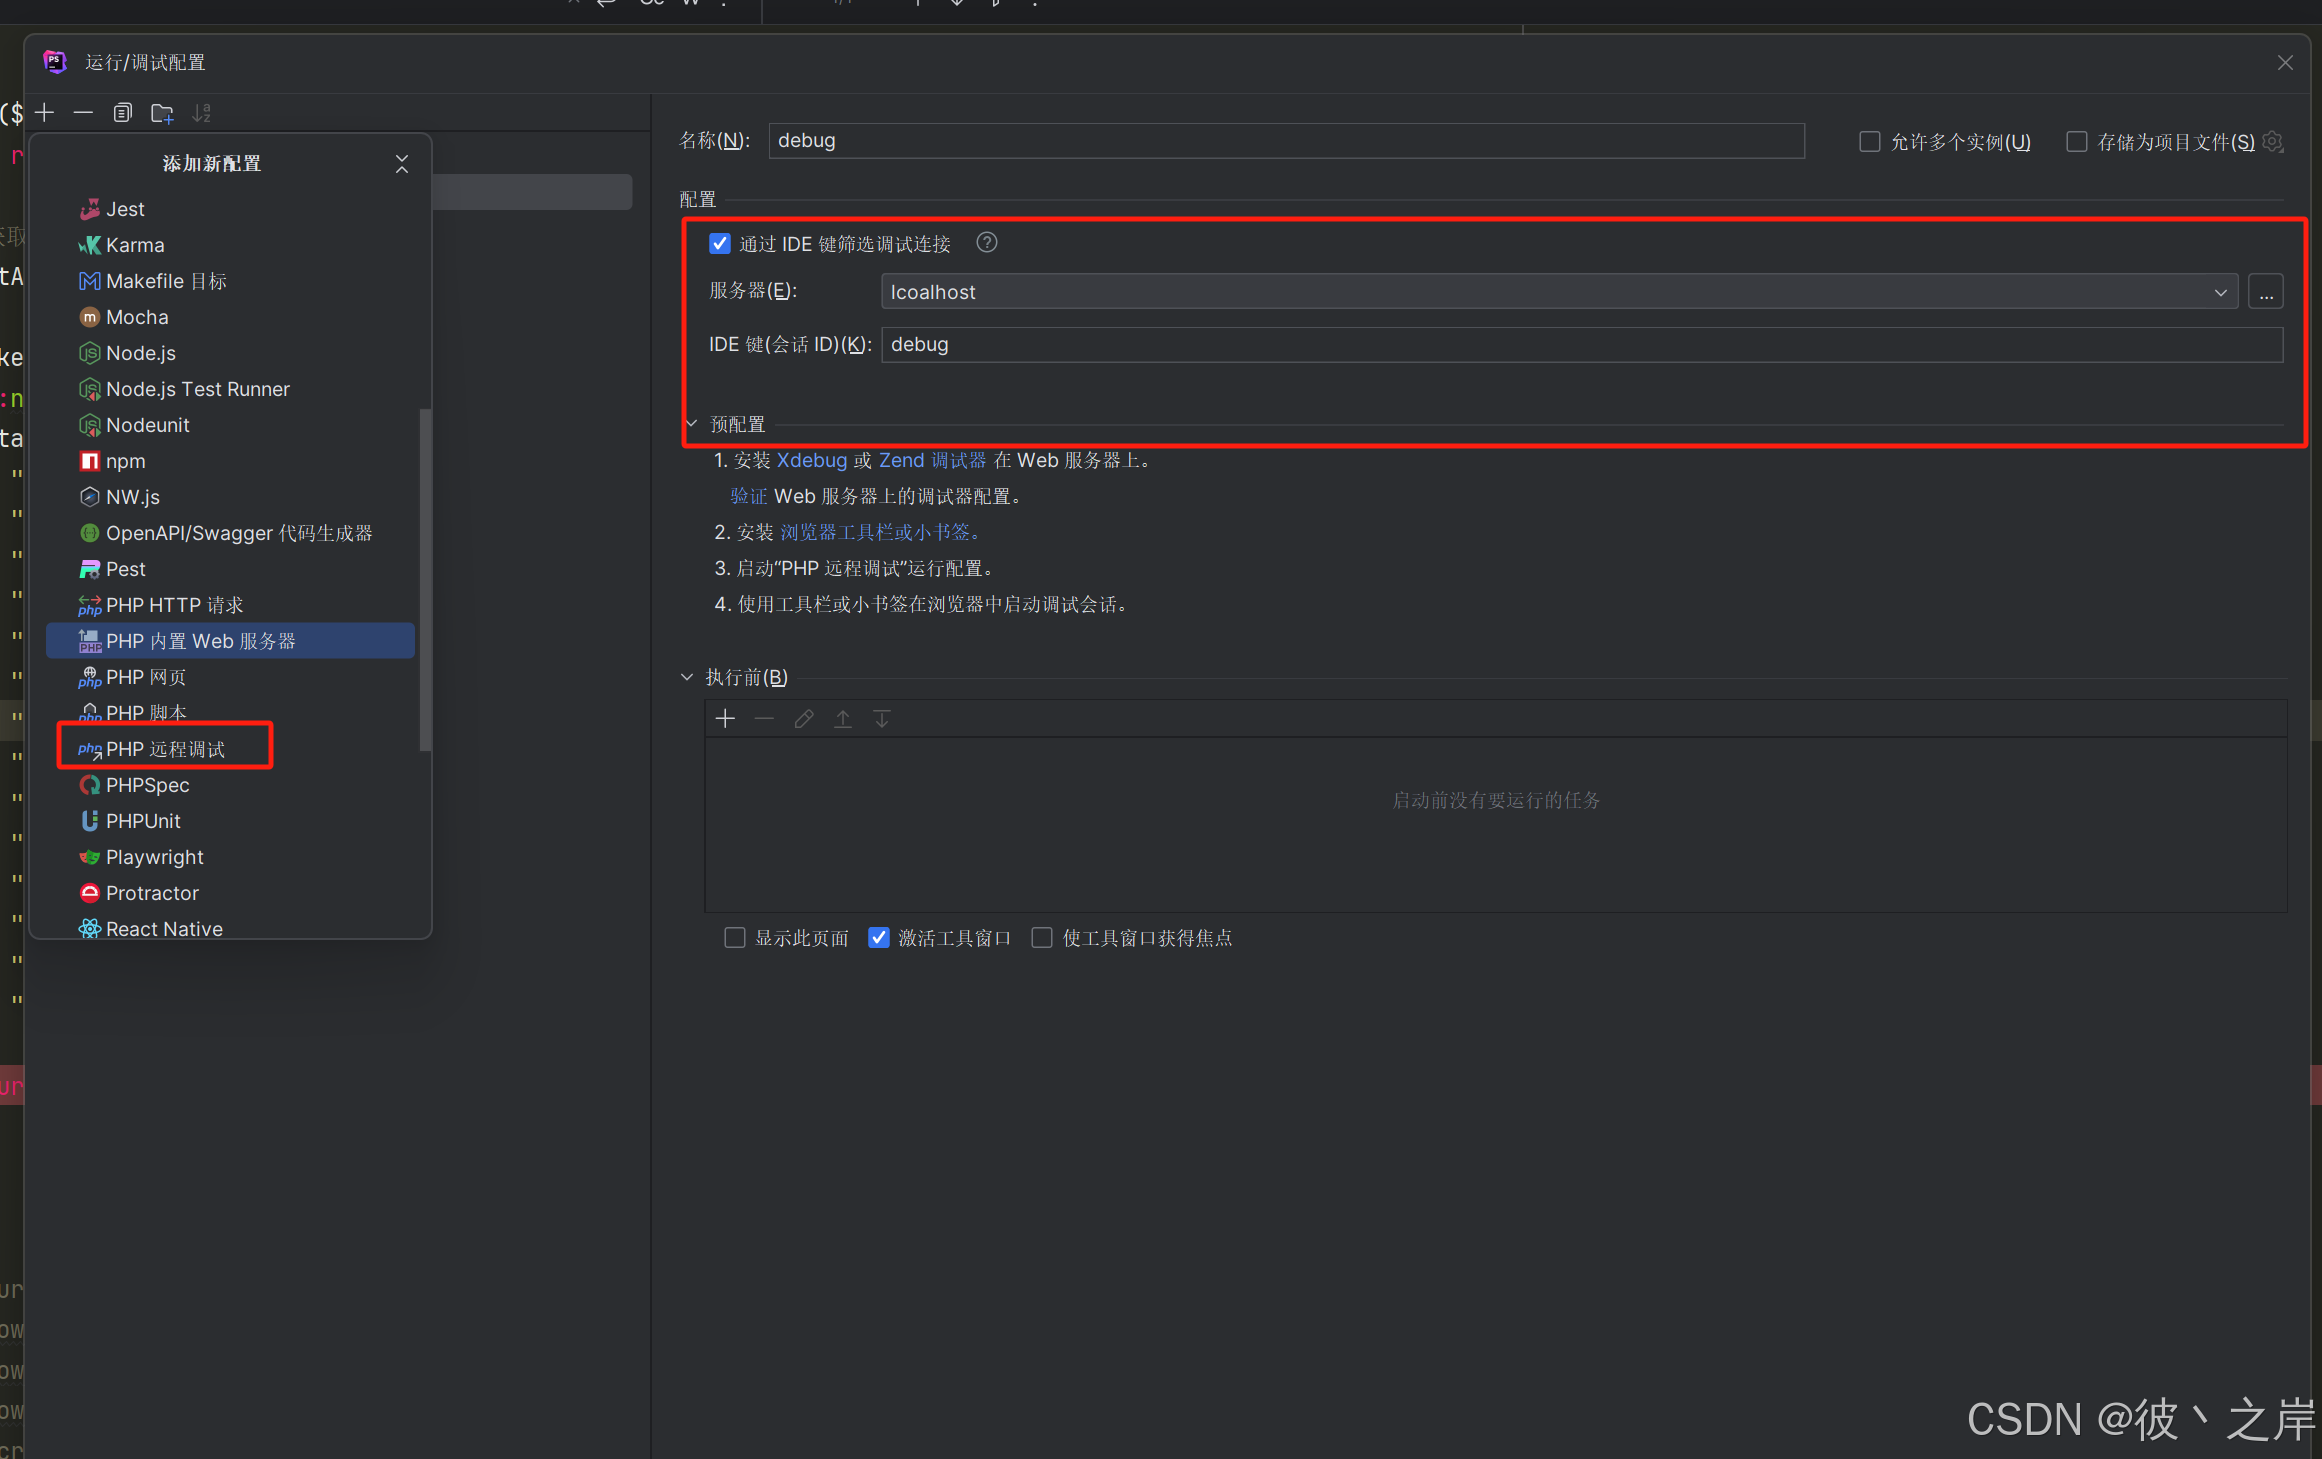
配置好后 启动端口 监听 这样的话 不管是postman 还是web访问 只要断点就能打印出来数据了

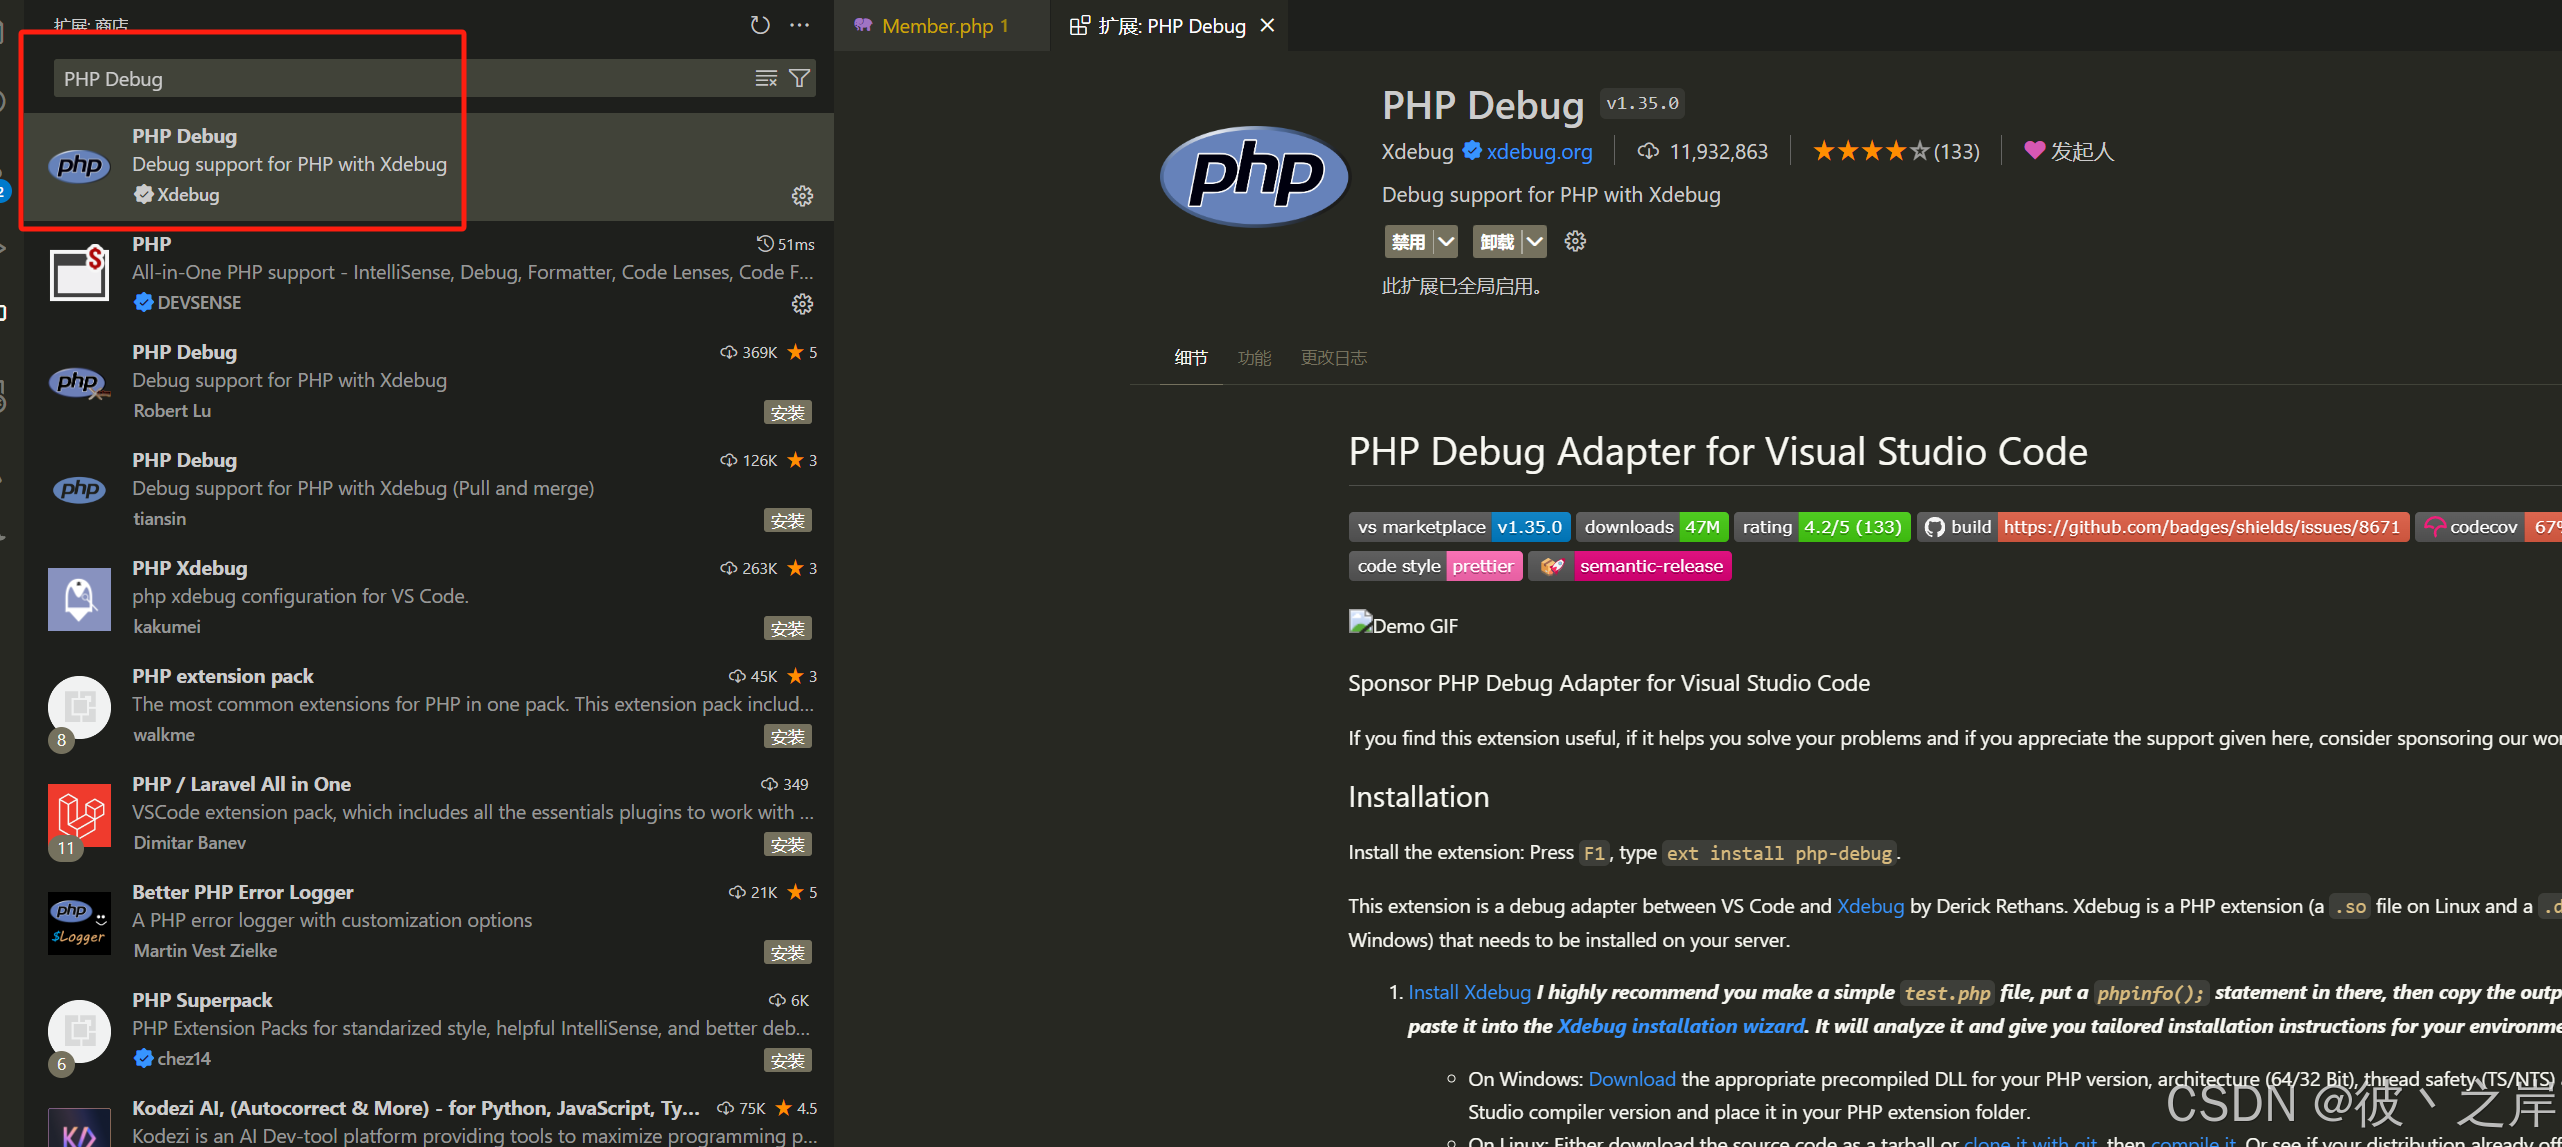
vscode 配置
- 去到商店下载PHP Debug扩展
- 根据自己安装的php目录配置好对应的路径注意windows是 \ \
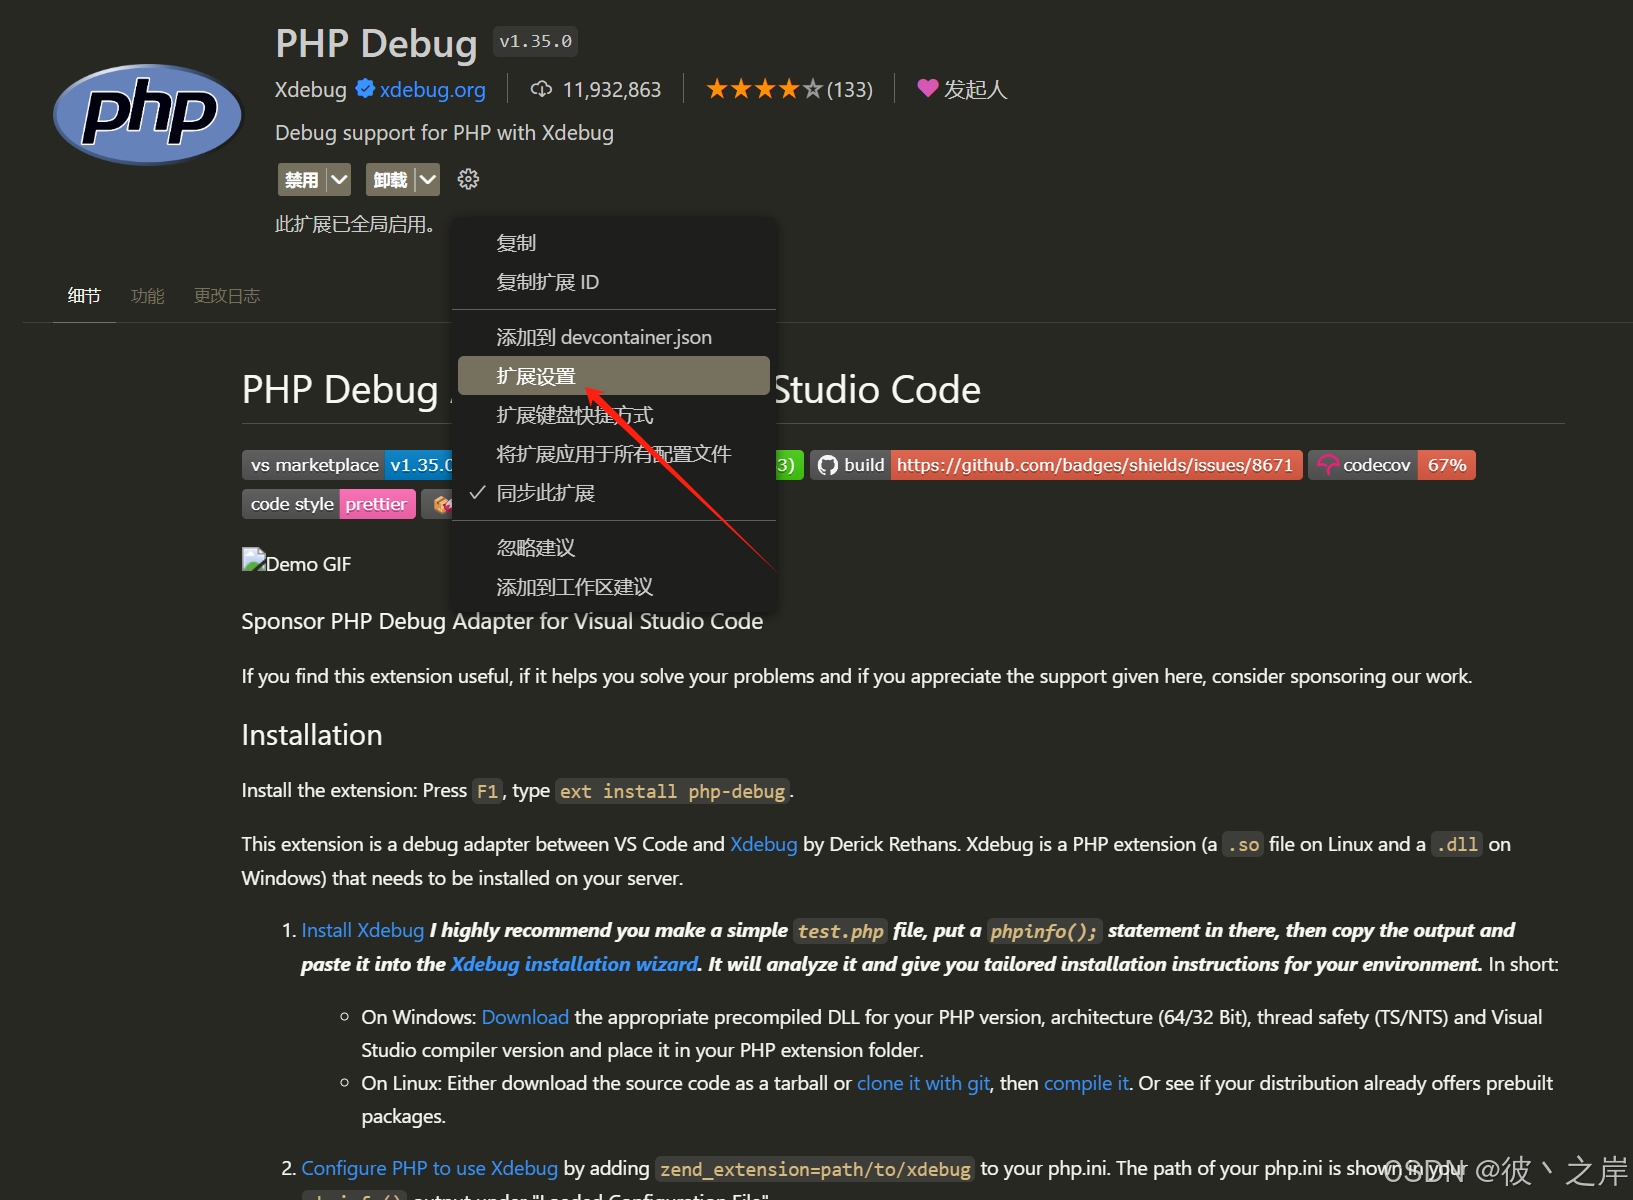
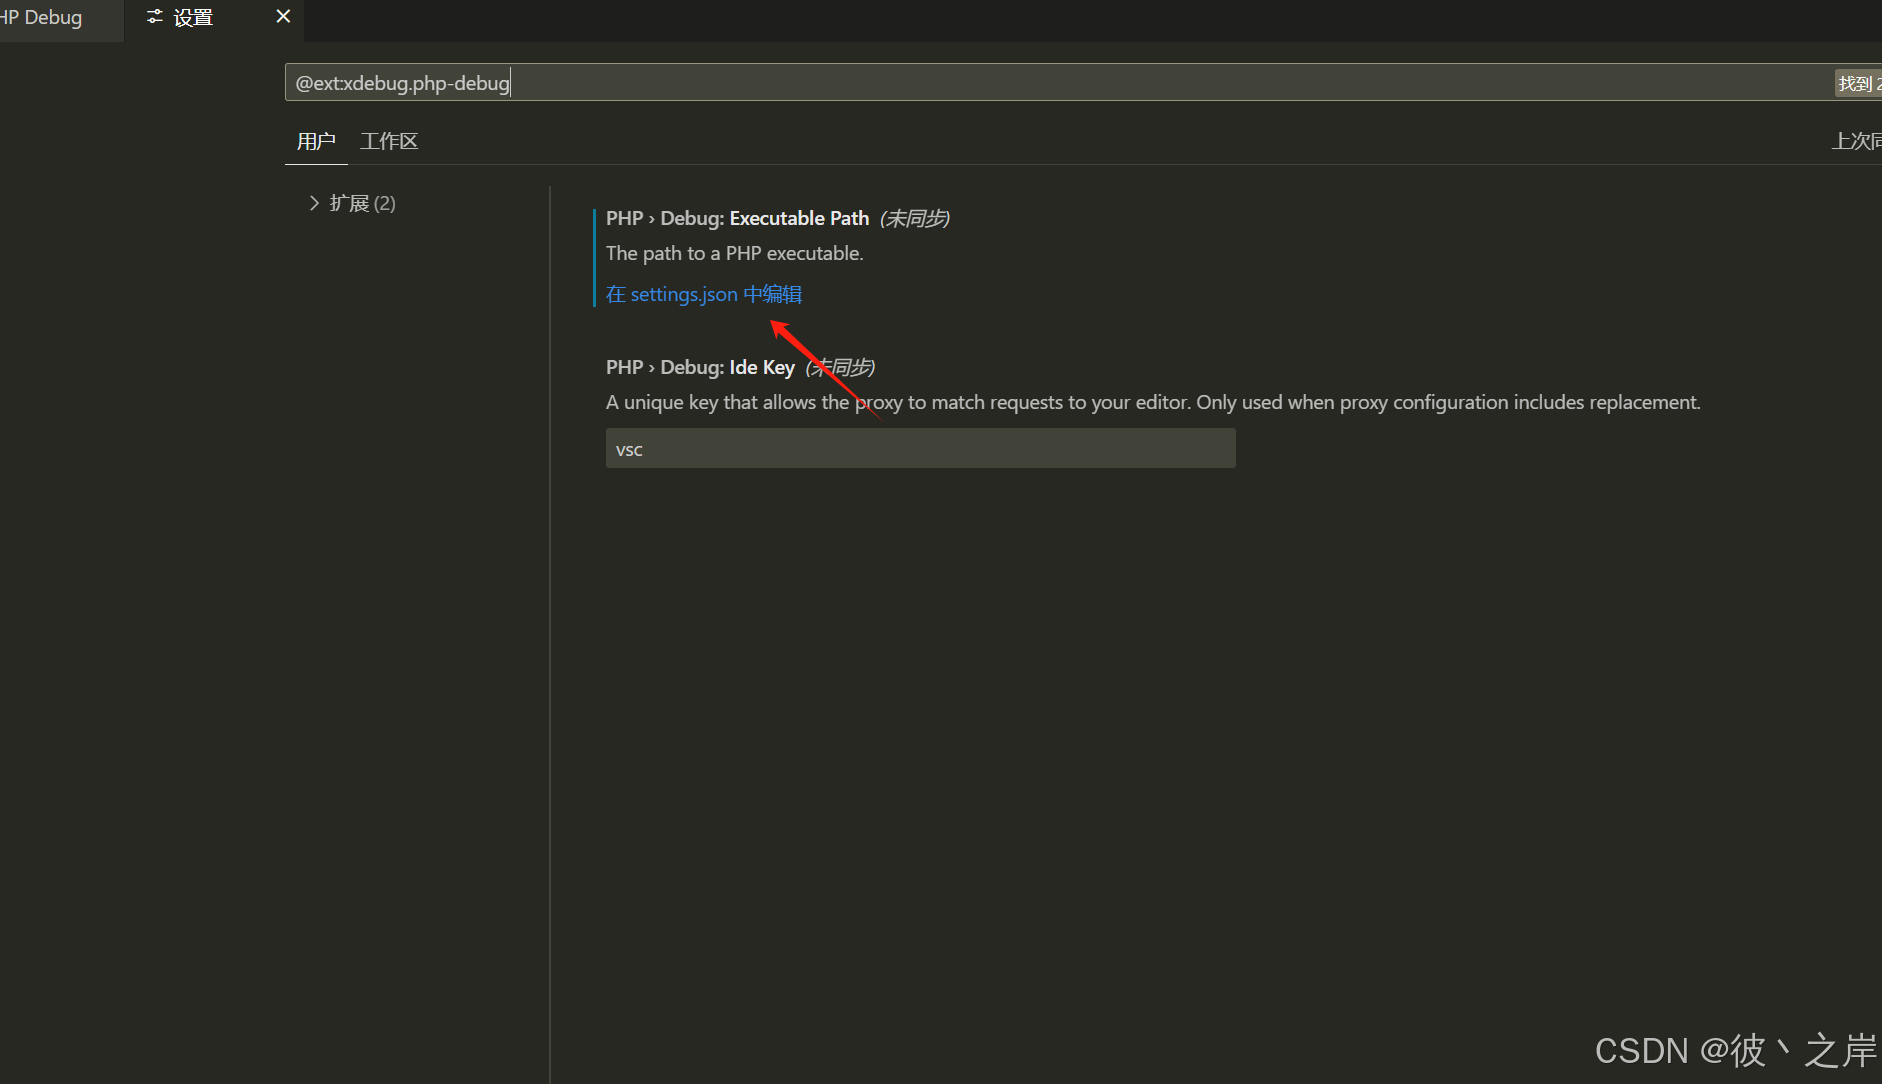
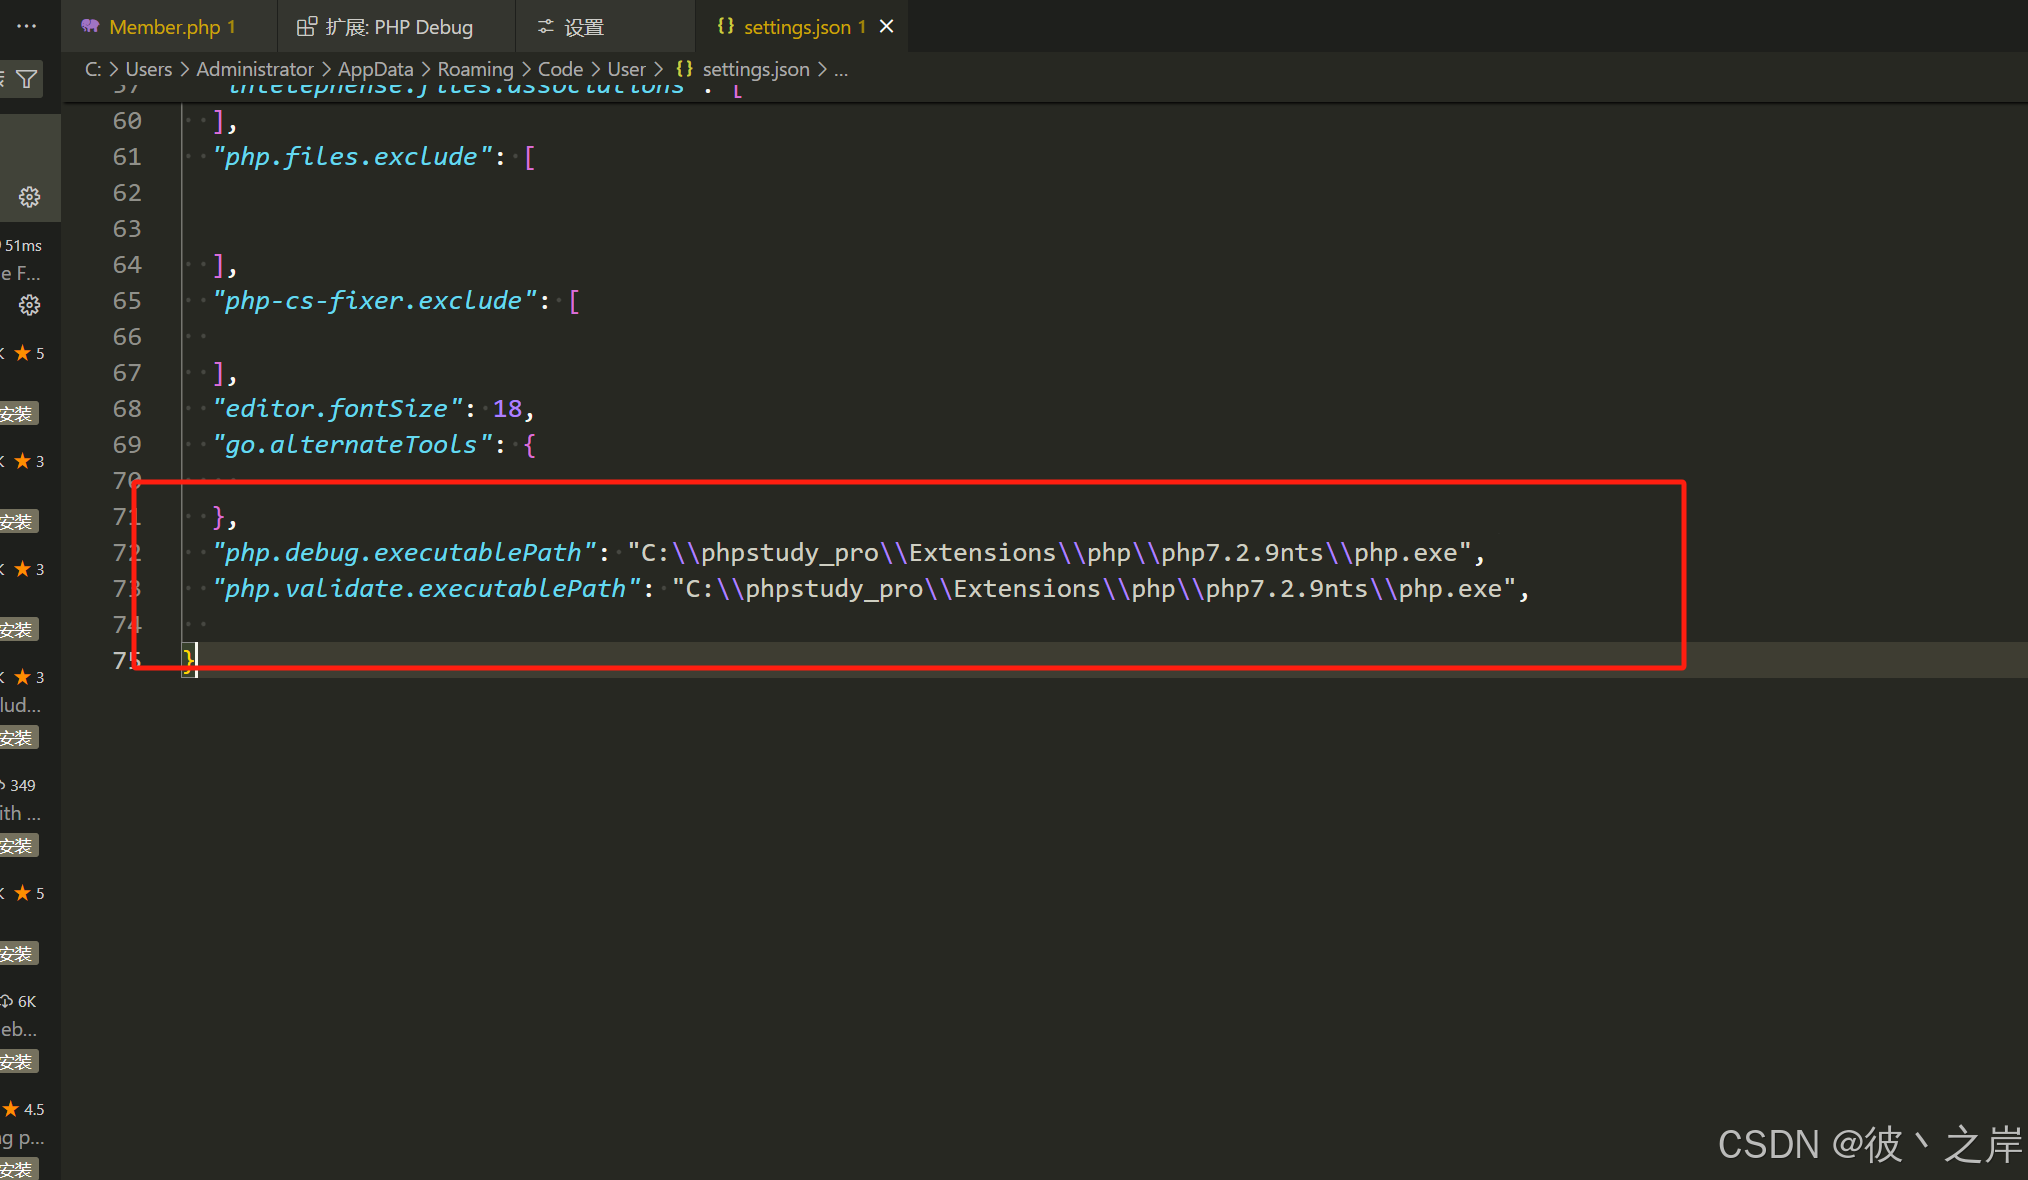
  "php.debug.executablePath": "C:\\phpstudy_pro\\Extensions\\php\\php7.2.9nts\\php.exe",
  "php.validate.executablePath": "C:\\phpstudy_pro\\Extensions\\php\\php7.2.9nts\\php.exe",
-
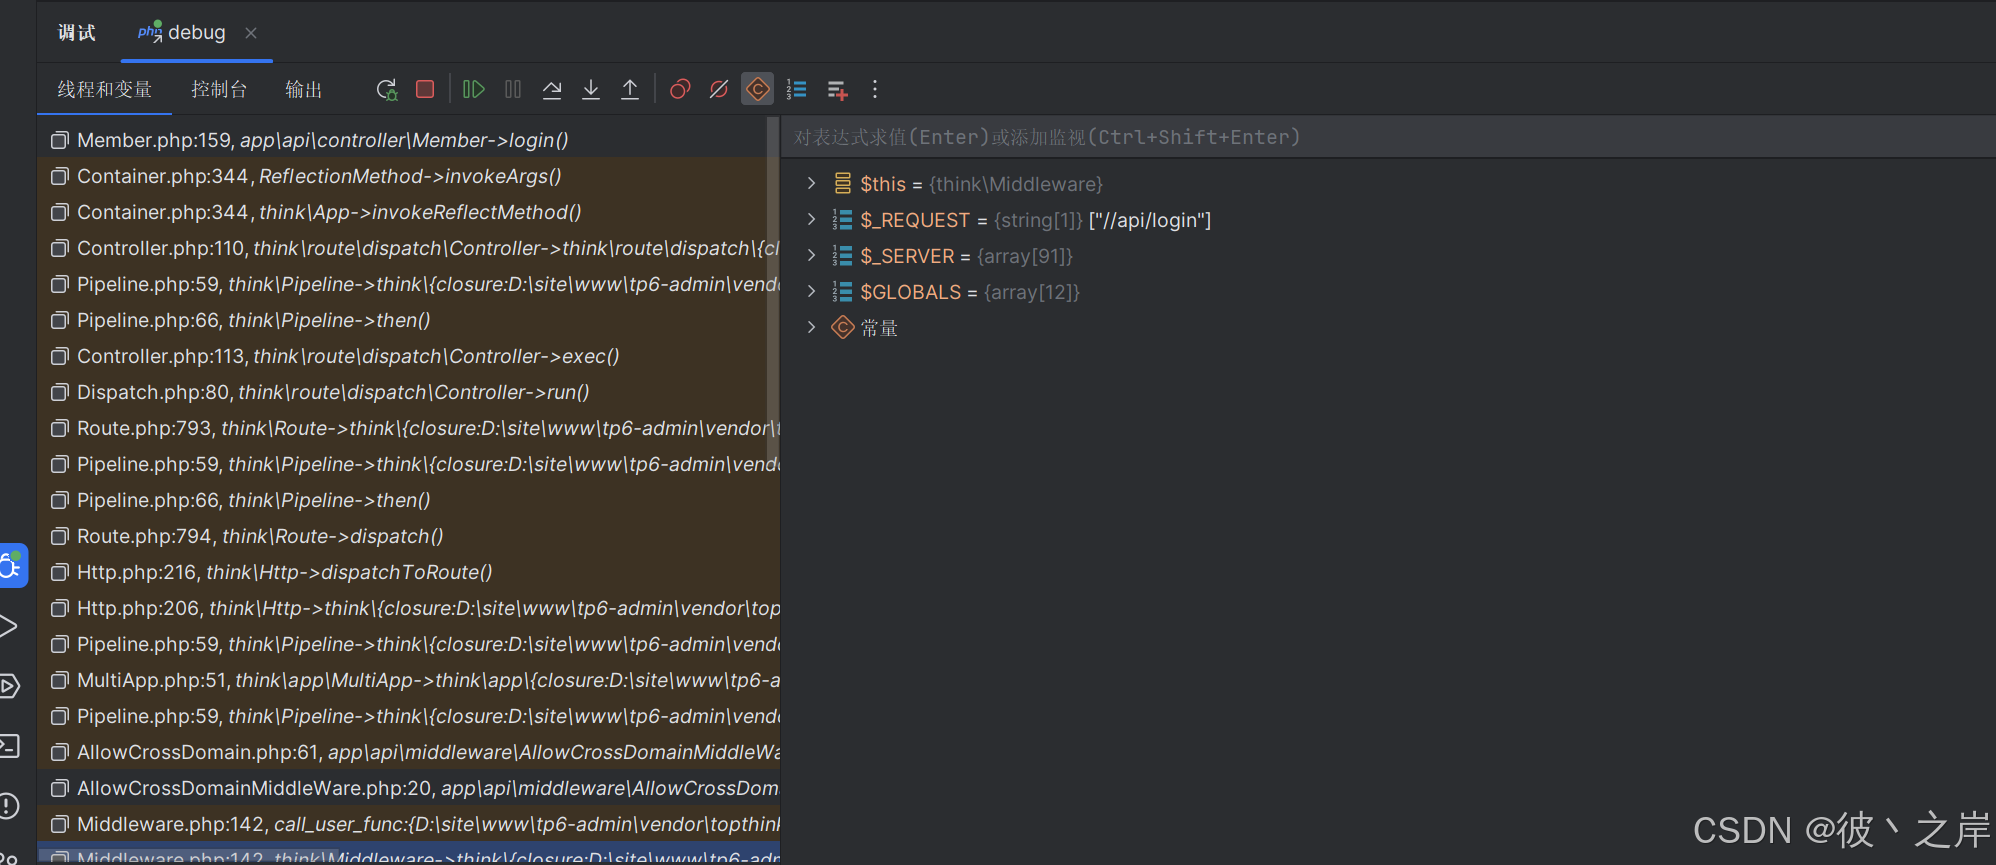
去到debug 找到listen for xdebug 配置完成后启动监听端口
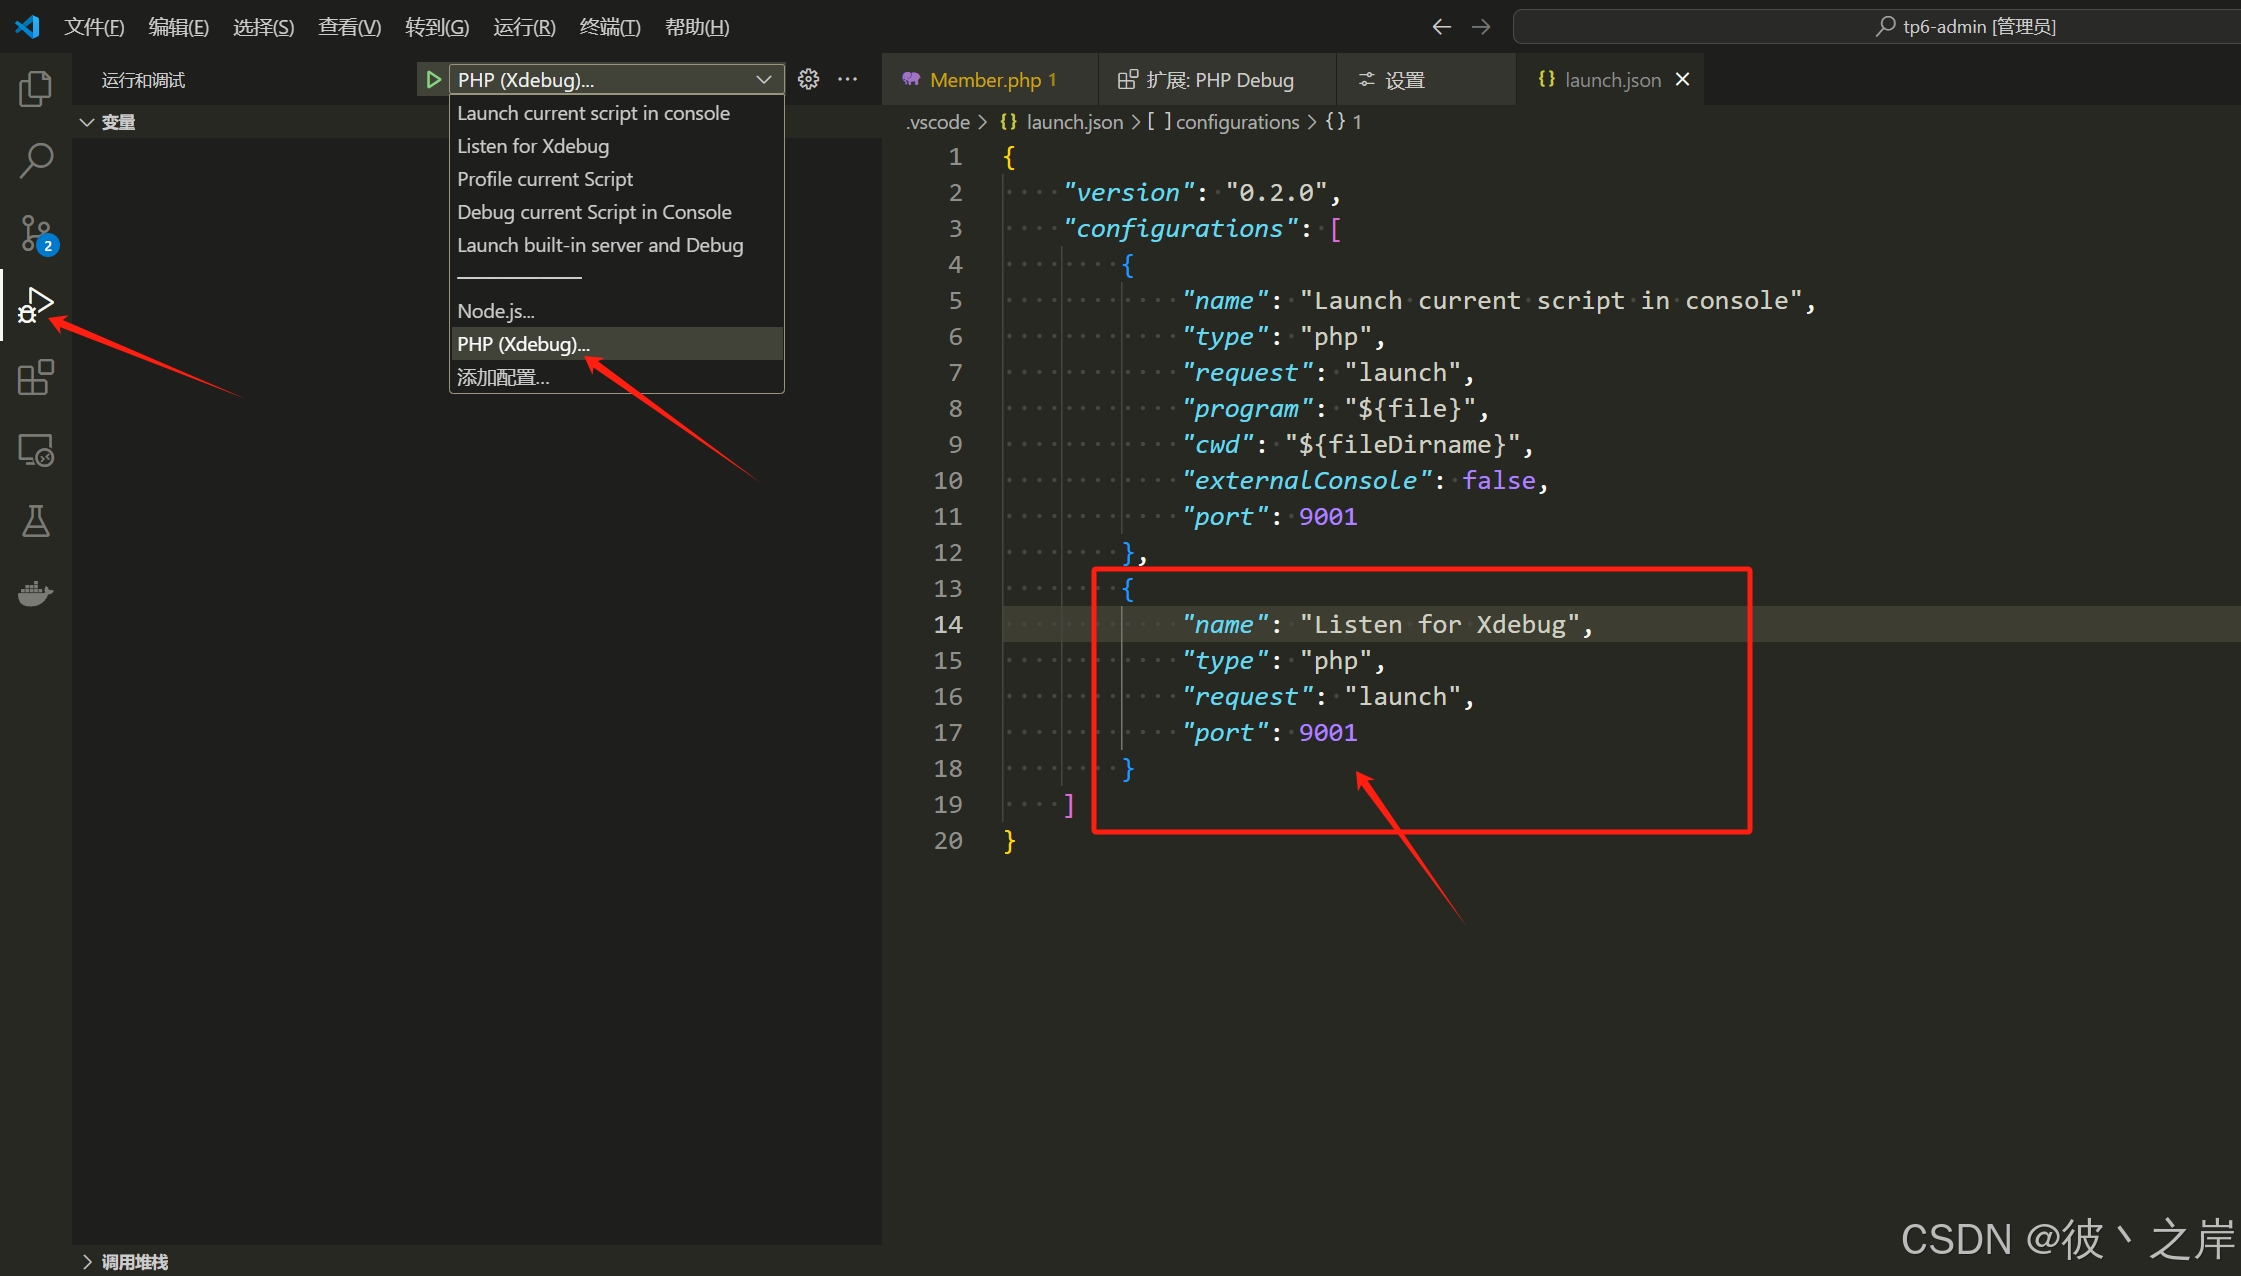
-
下面就是正常的启动了监听9001端口 这样就去到对应的代码断点就可以
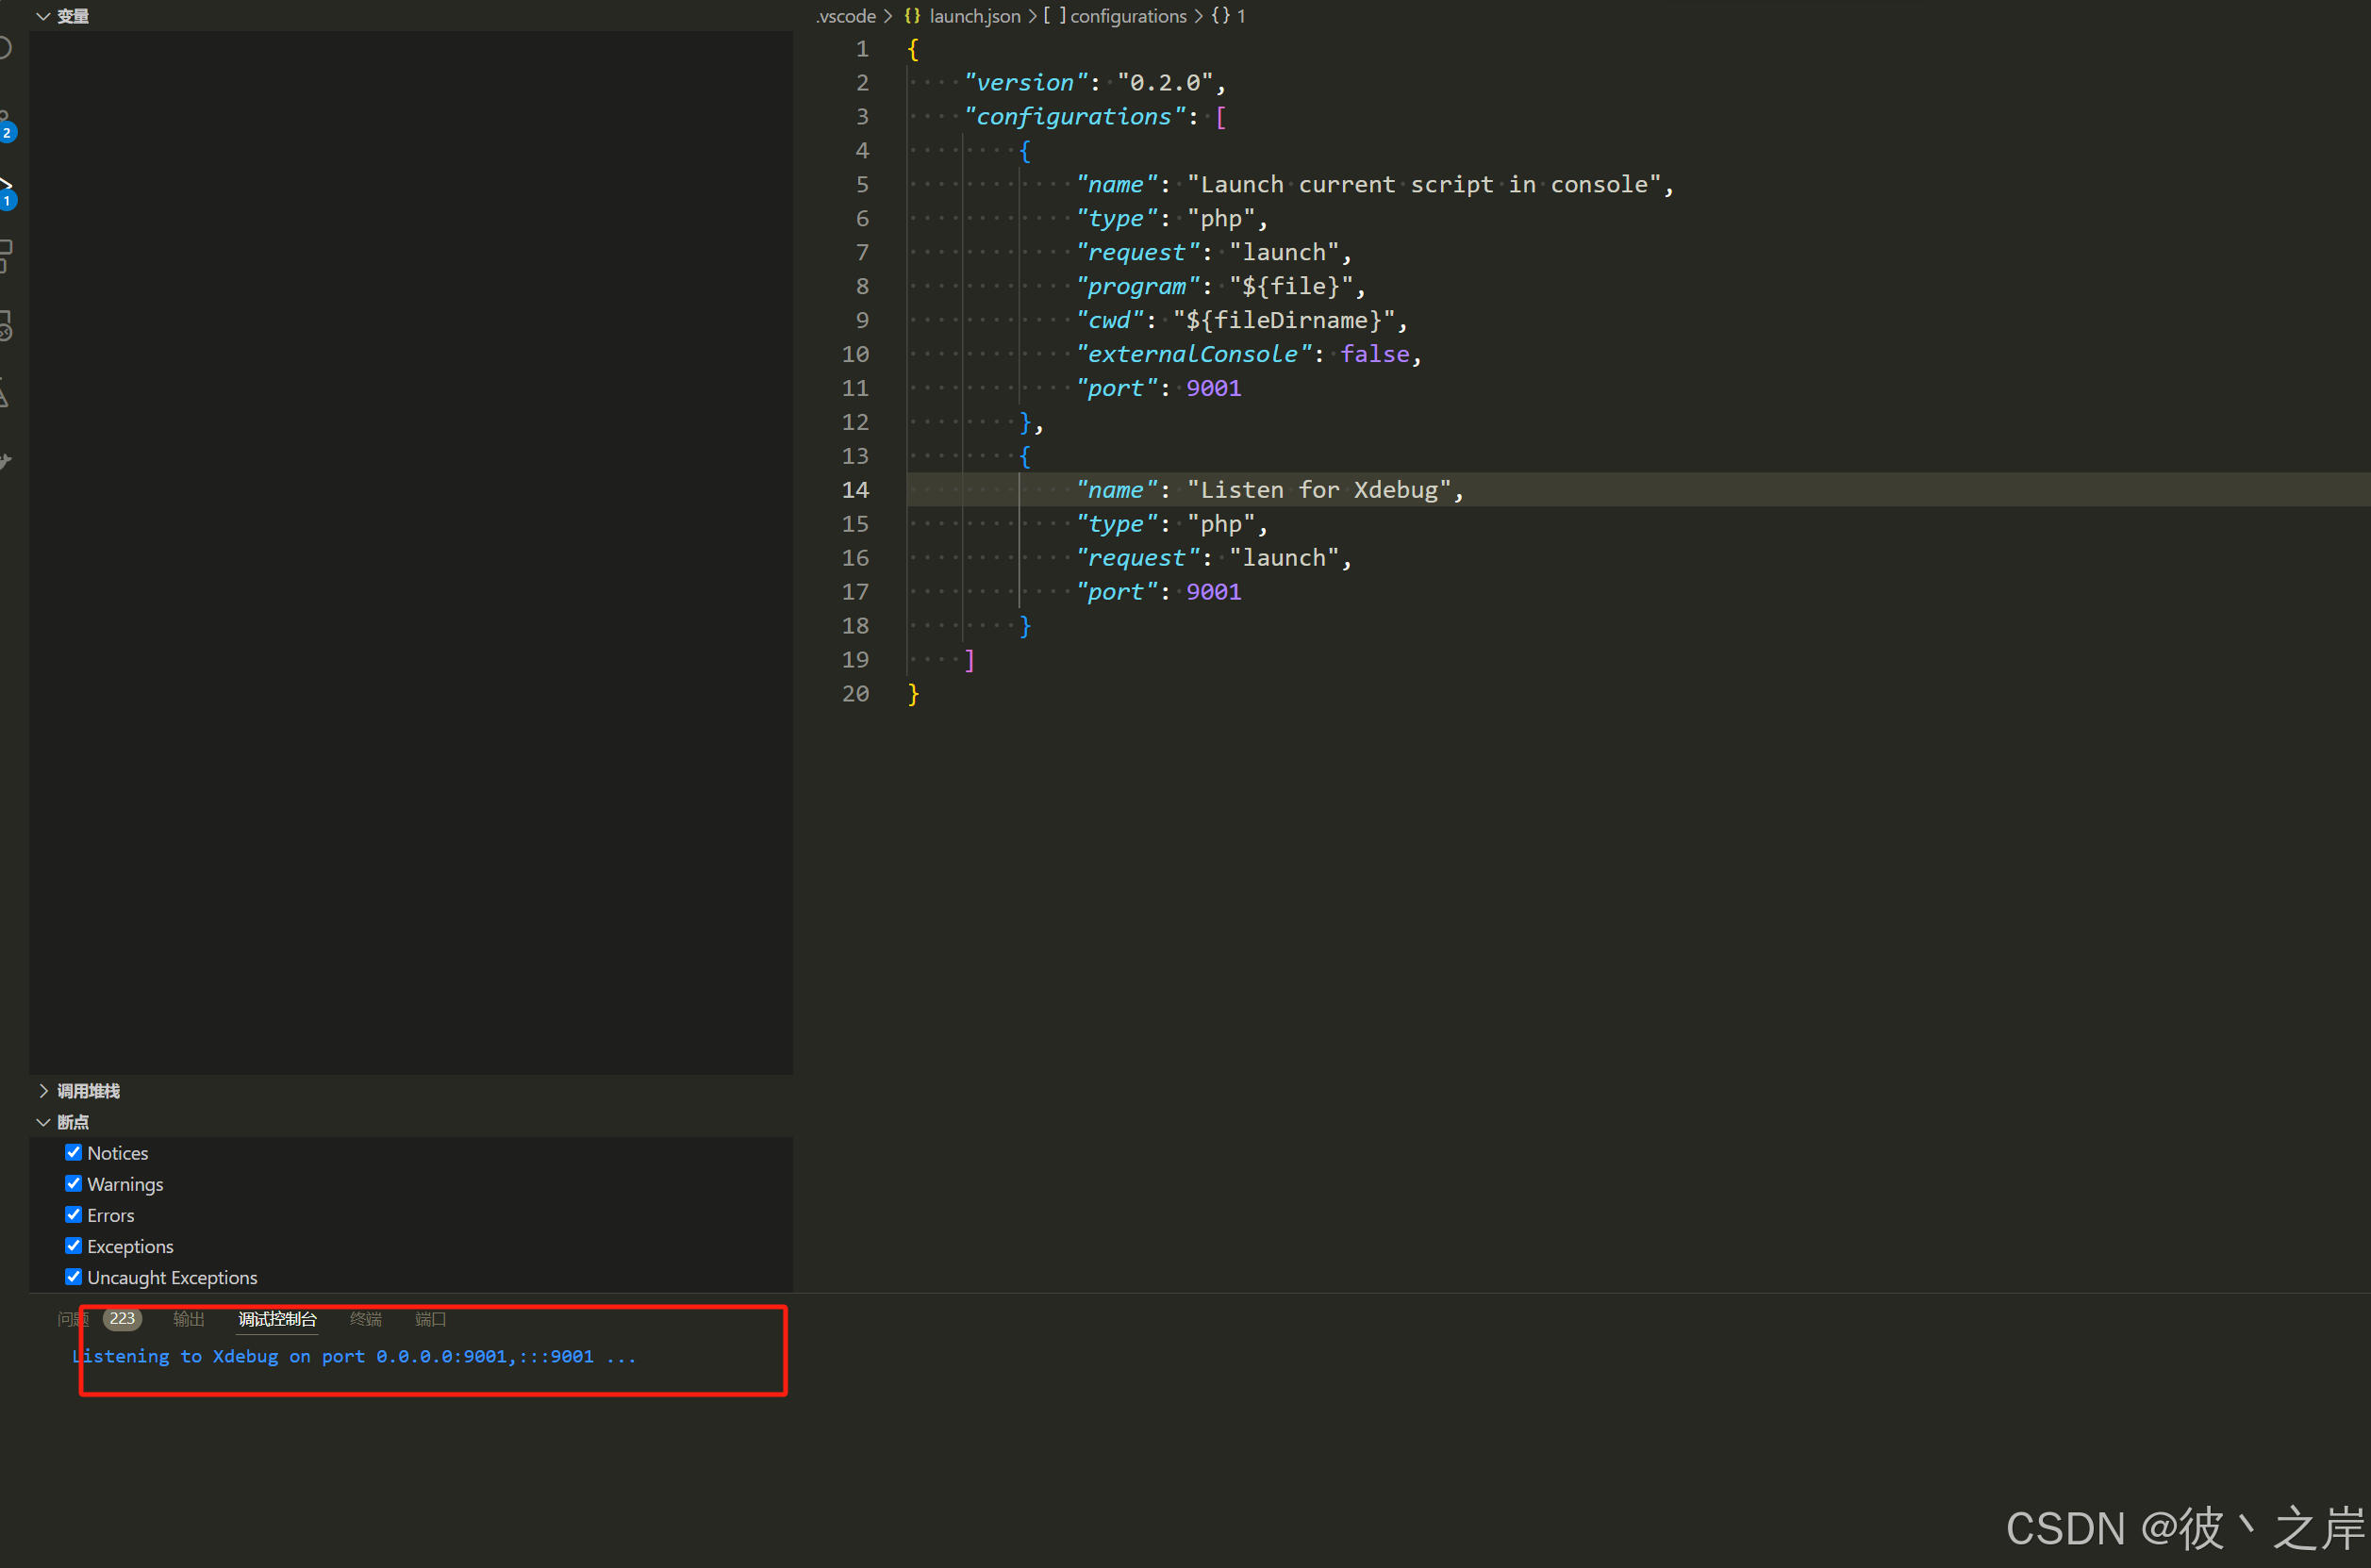
这样就大功告成了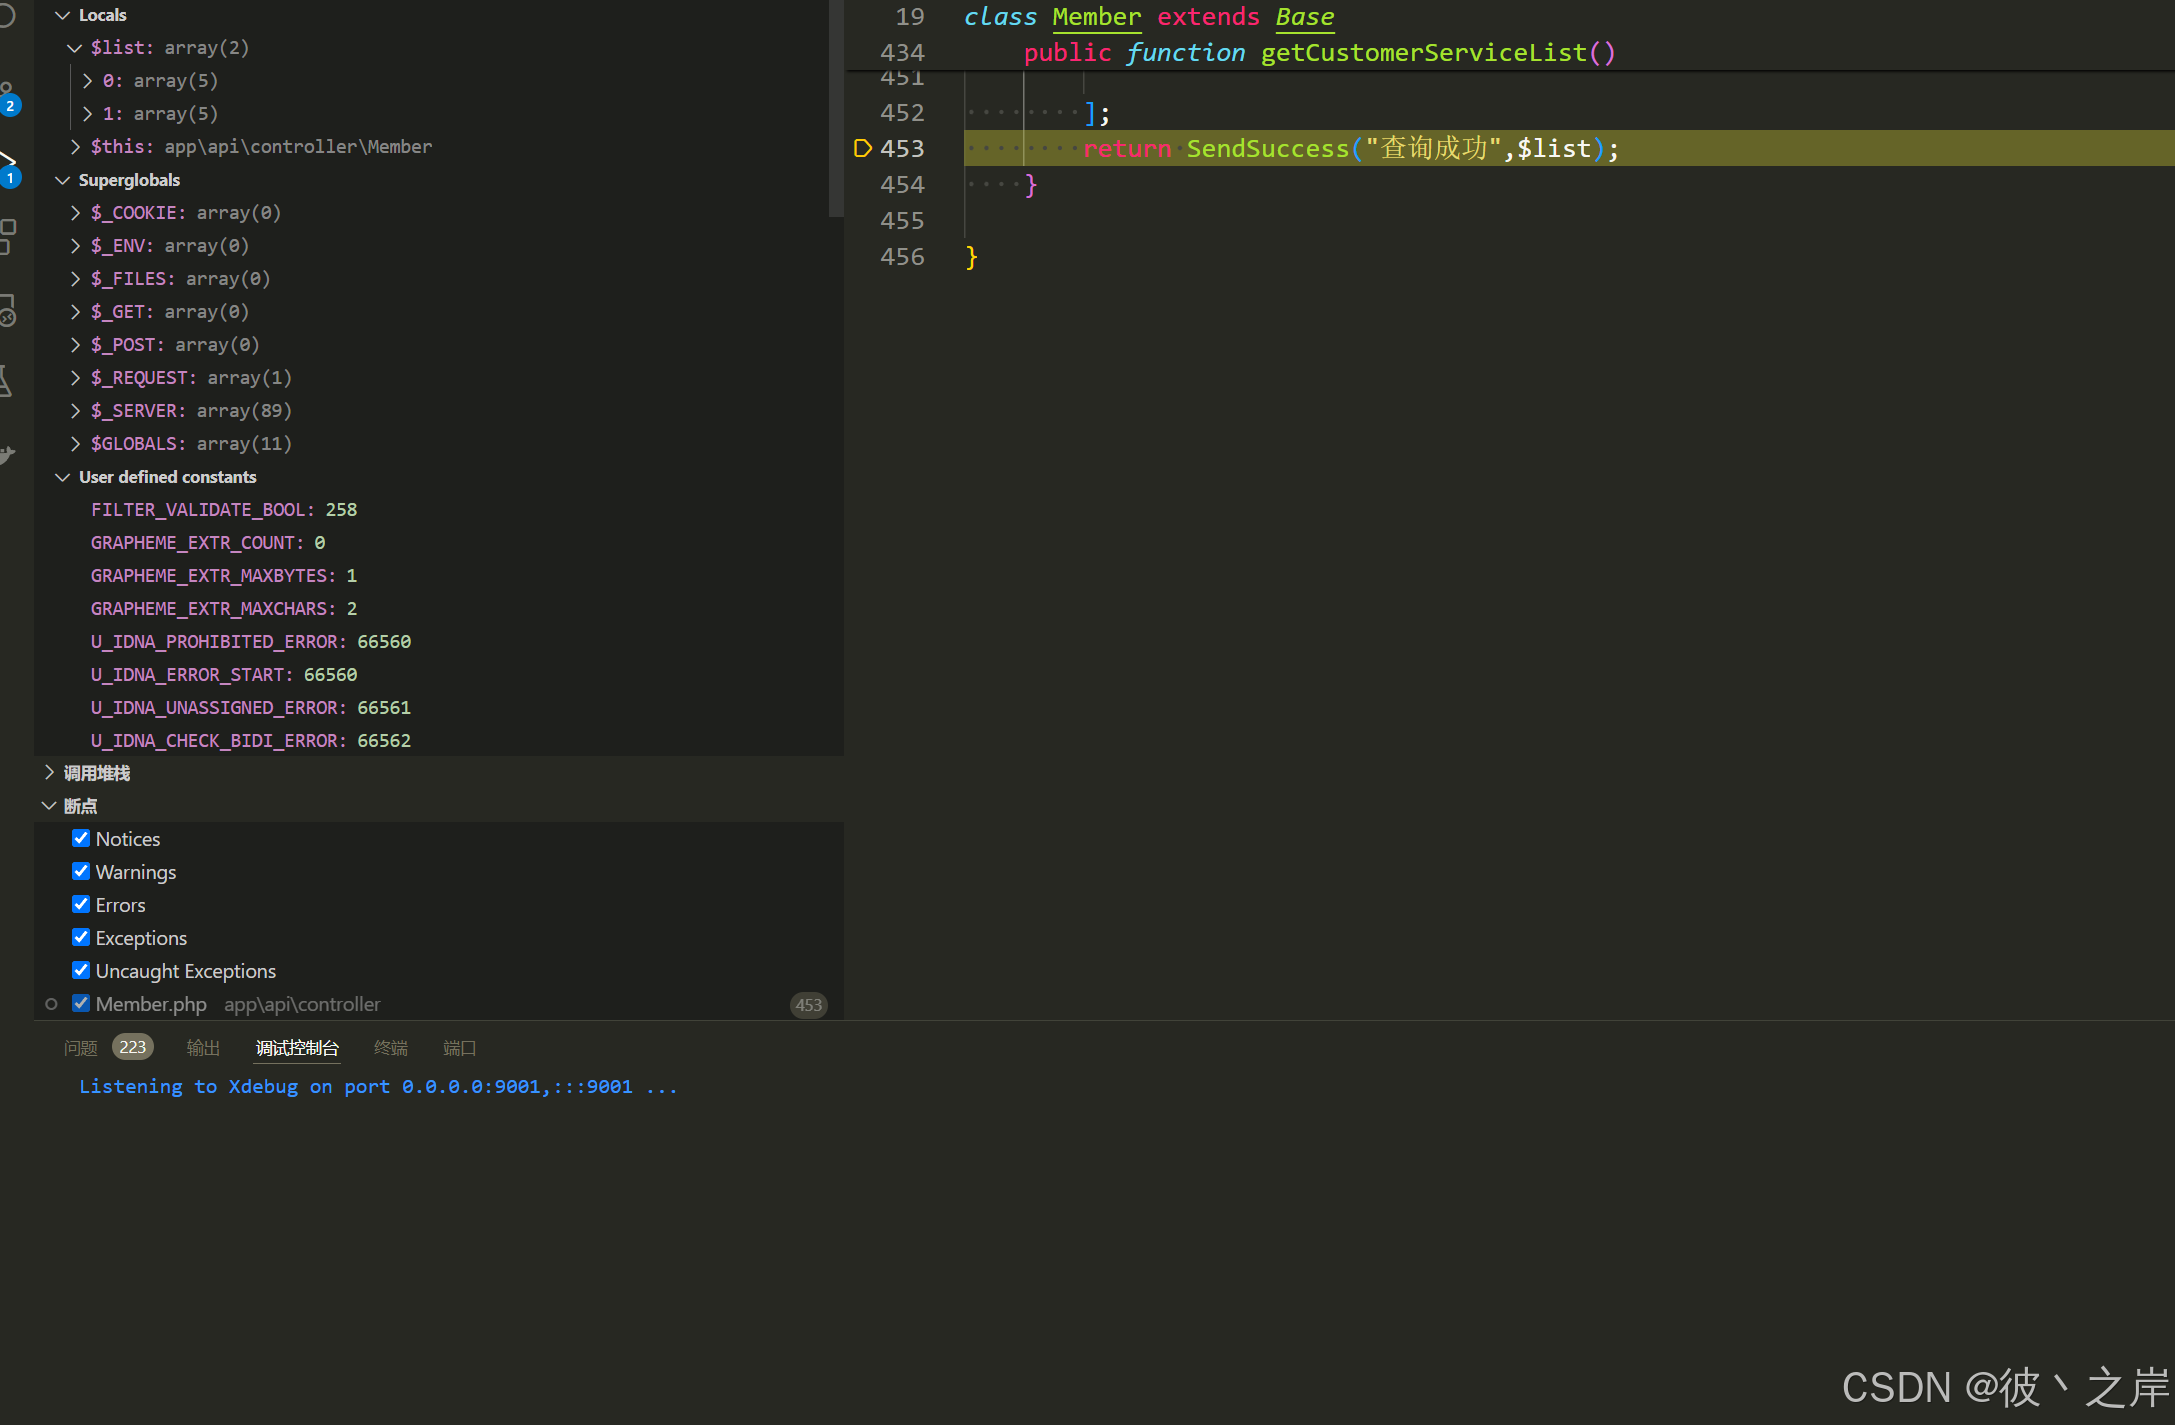

腾讯云面向开发者汇聚海量精品云计算使用和开发经验,营造开放的云计算技术生态圈。
更多推荐
 4
4 0
0- 0


 已为社区贡献1条内容

所有评论(0)