windows 环境docker desktop 搭建prometheus、grafana、node-exporter
·
一、创建自定义Docker网络
首先,创建一个自定义Docker网络,以确保两个容器可以互相通信:
docker network create monitoring二、拉取镜像 prometheus、grafana、node-exporter
docker pull prom/prometheus:v3.0.1

docker run grafana/grafana:11.4.0

docker pull prom/node-exporter:v1.8.2
三、启动容器
docker run -d --name prometheus -p 9090:9090 --network monitoring prom/prometheus:v3.0.1

docker run -d --name grafana -p 3000:3000 --network monitoring grafana/grafana:11.4.0

docker run -d --name node-exporter -p 9100:9100 --network monitoring prom/node-exporter:v1.8.2
四、prometheus 配置文件修改
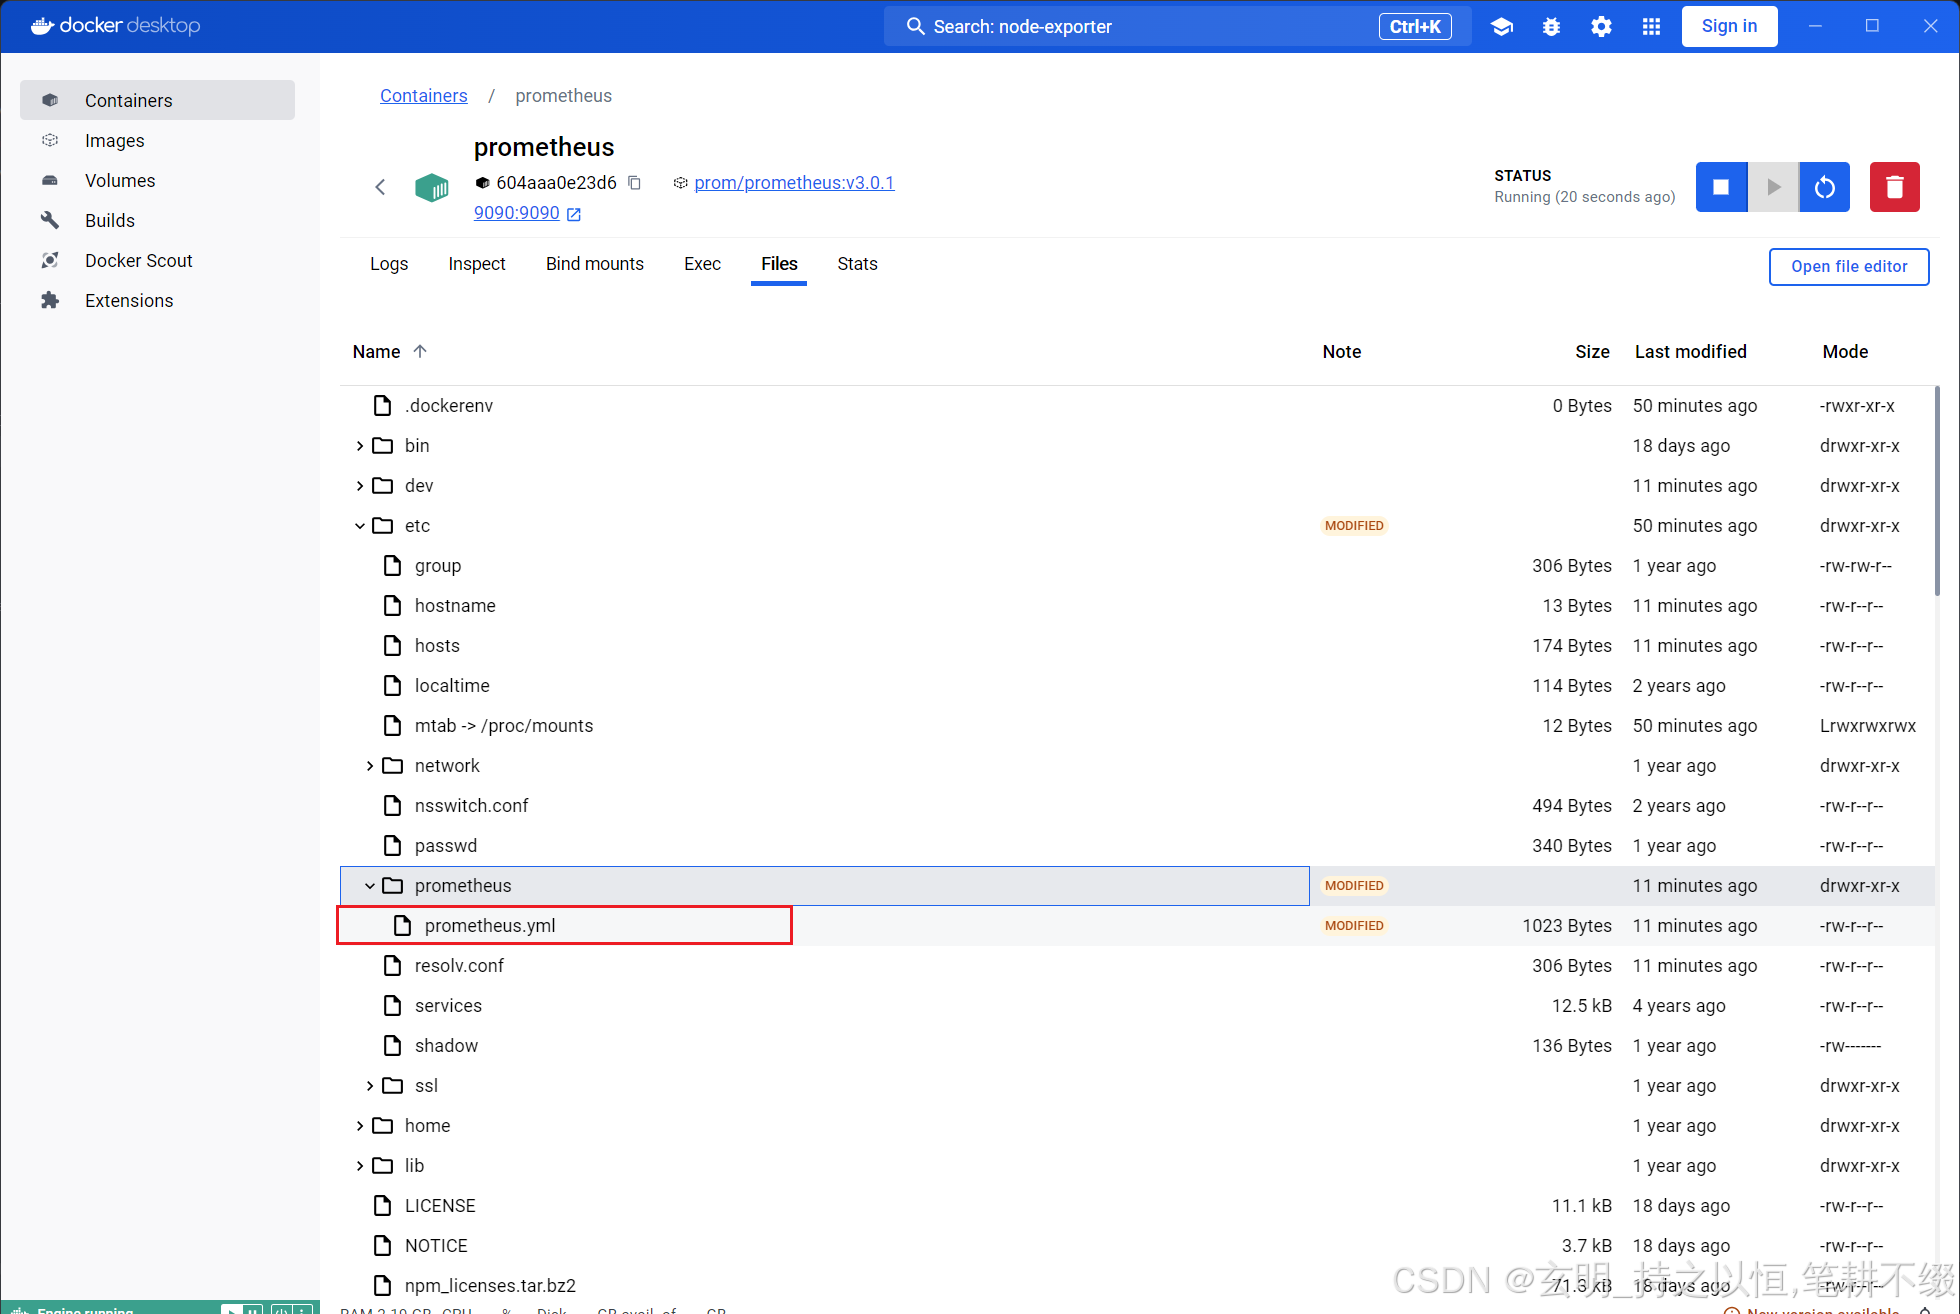
# my global config
global:
  scrape_interval: 15s # Set the scrape interval to every 15 seconds. Default is every 1 minute.
  evaluation_interval: 15s # Evaluate rules every 15 seconds. The default is every 1 minute.
  # scrape_timeout is set to the global default (10s).

# Alertmanager configuration
alerting:
  alertmanagers:
    - static_configs:
        - targets:
          # - alertmanager:9093

# Load rules once and periodically evaluate them according to the global 'evaluation_interval'.
rule_files:
  # - "first_rules.yml"
  # - "second_rules.yml"

# A scrape configuration containing exactly one endpoint to scrape:
# Here it's Prometheus itself.
scrape_configs:
  # The job name is added as a label `job=<job_name>` to any timeseries scraped from this config.
  - job_name: "prometheus"

    # metrics_path defaults to '/metrics'
    # scheme defaults to 'http'.

    static_configs:
      - targets: ["172.17.0.1:9090","172.17.0.1:9100"]
        labels:
          instance: prometheus
五、配置
url地址
prometheus:Prometheus
grafana:Grafana admin/admin
node-exporter:node-exporter
grafana 配置prometheus数据源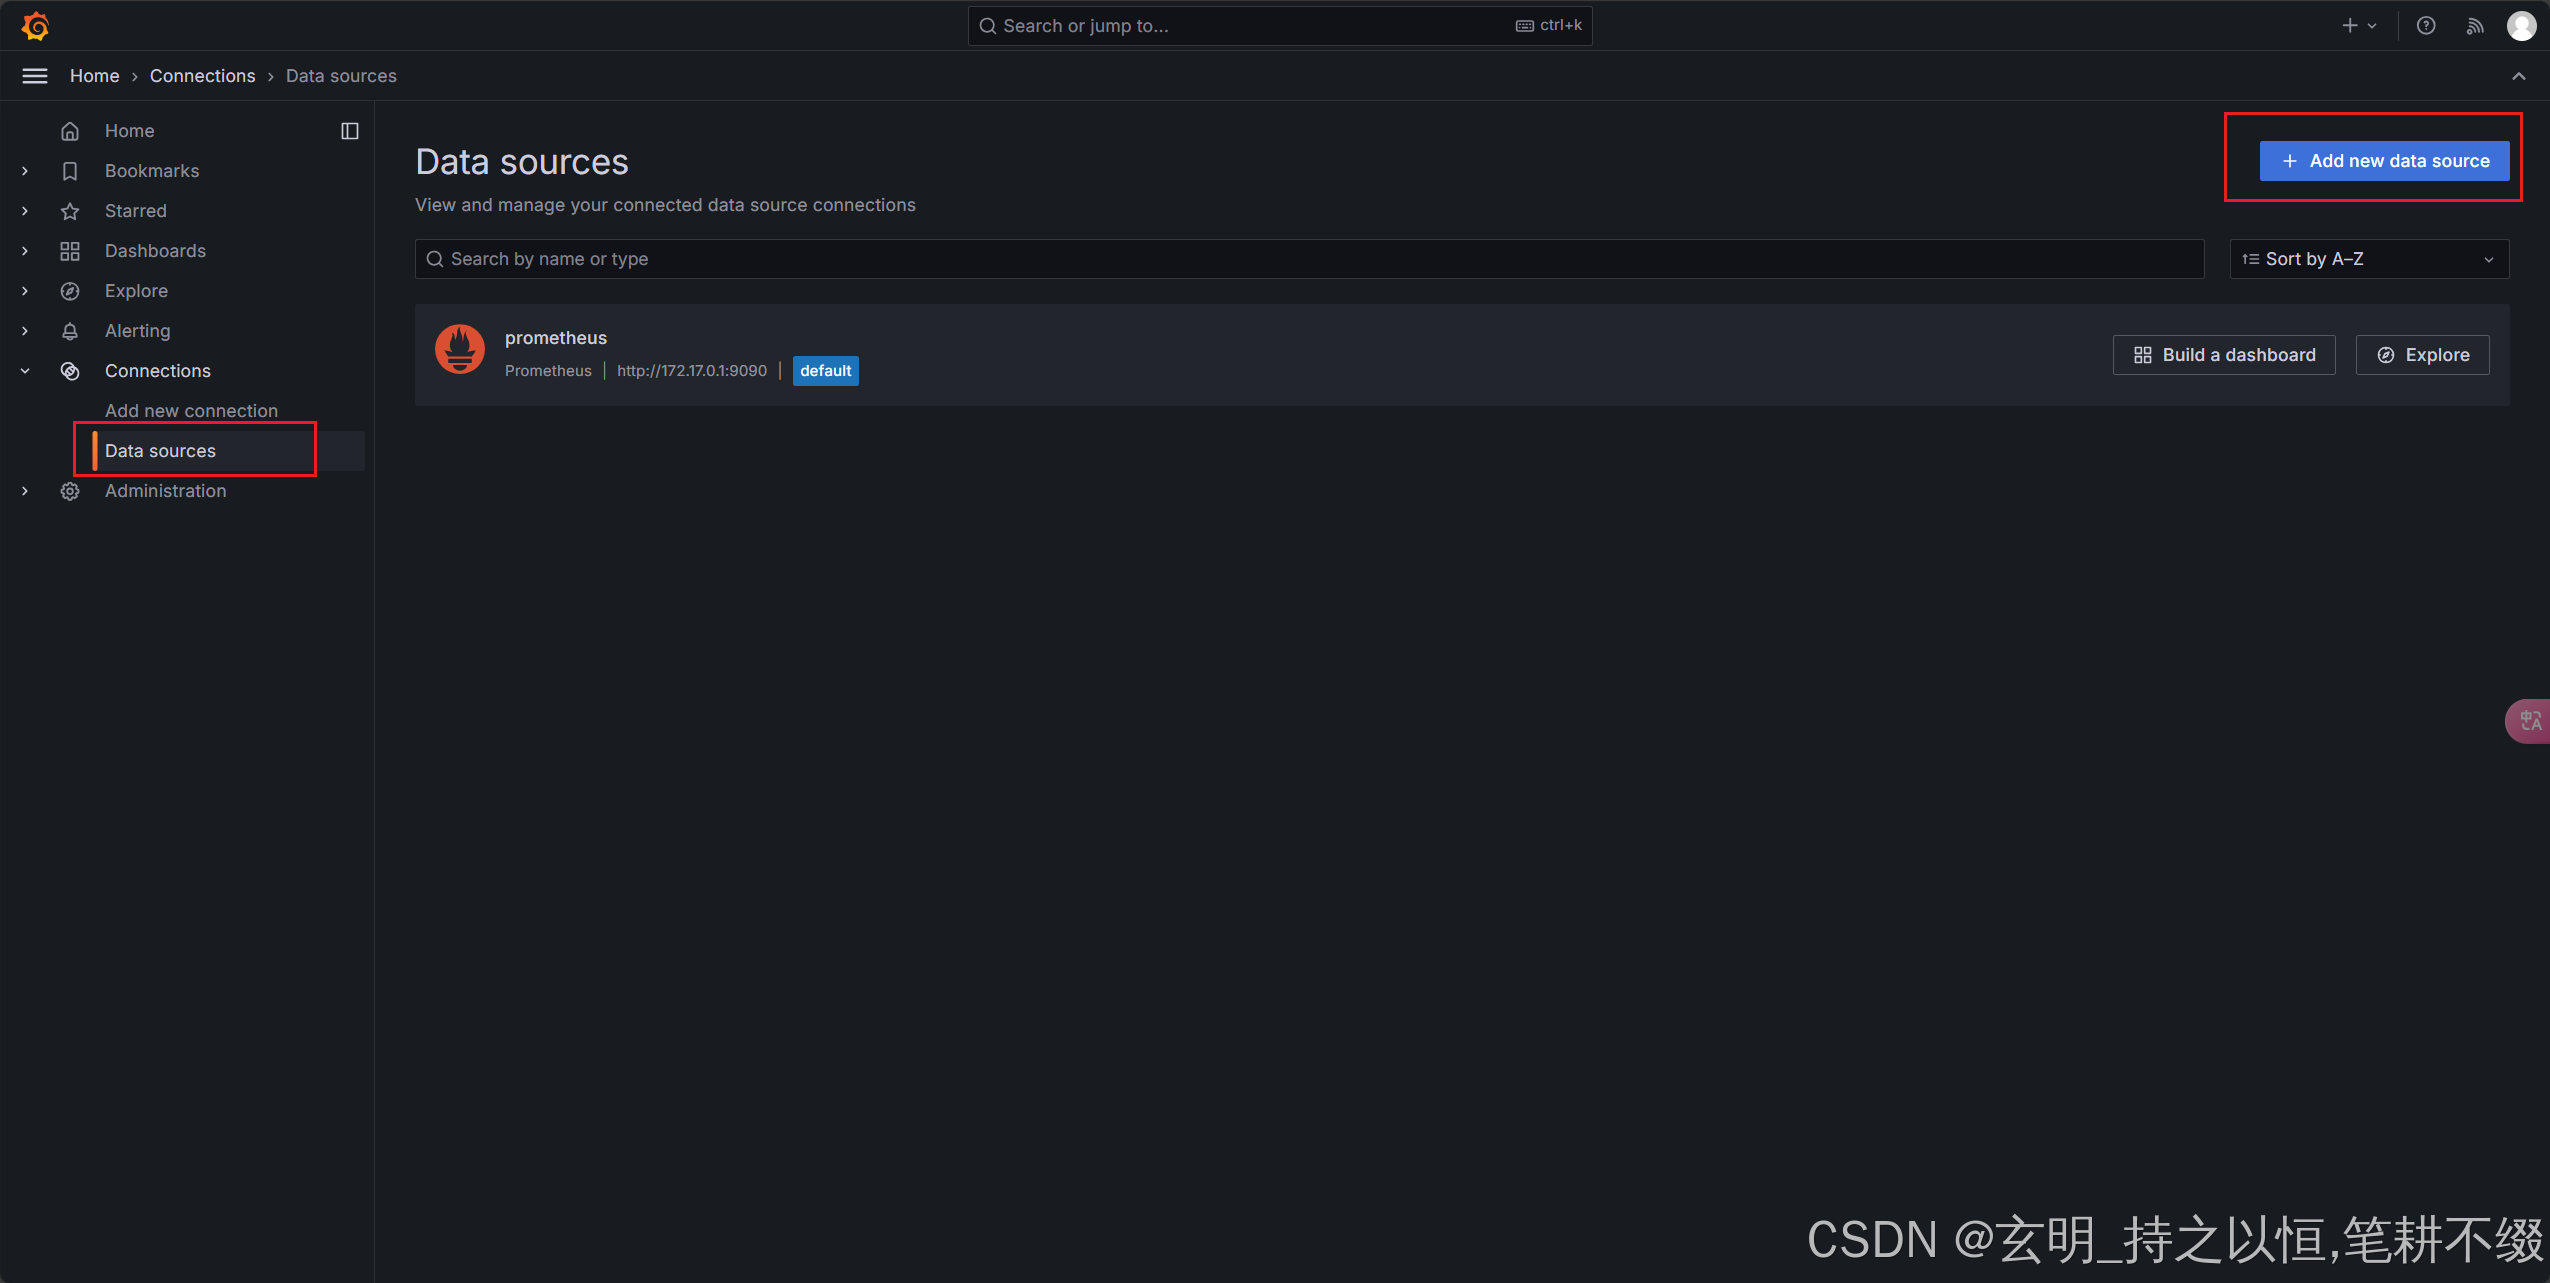
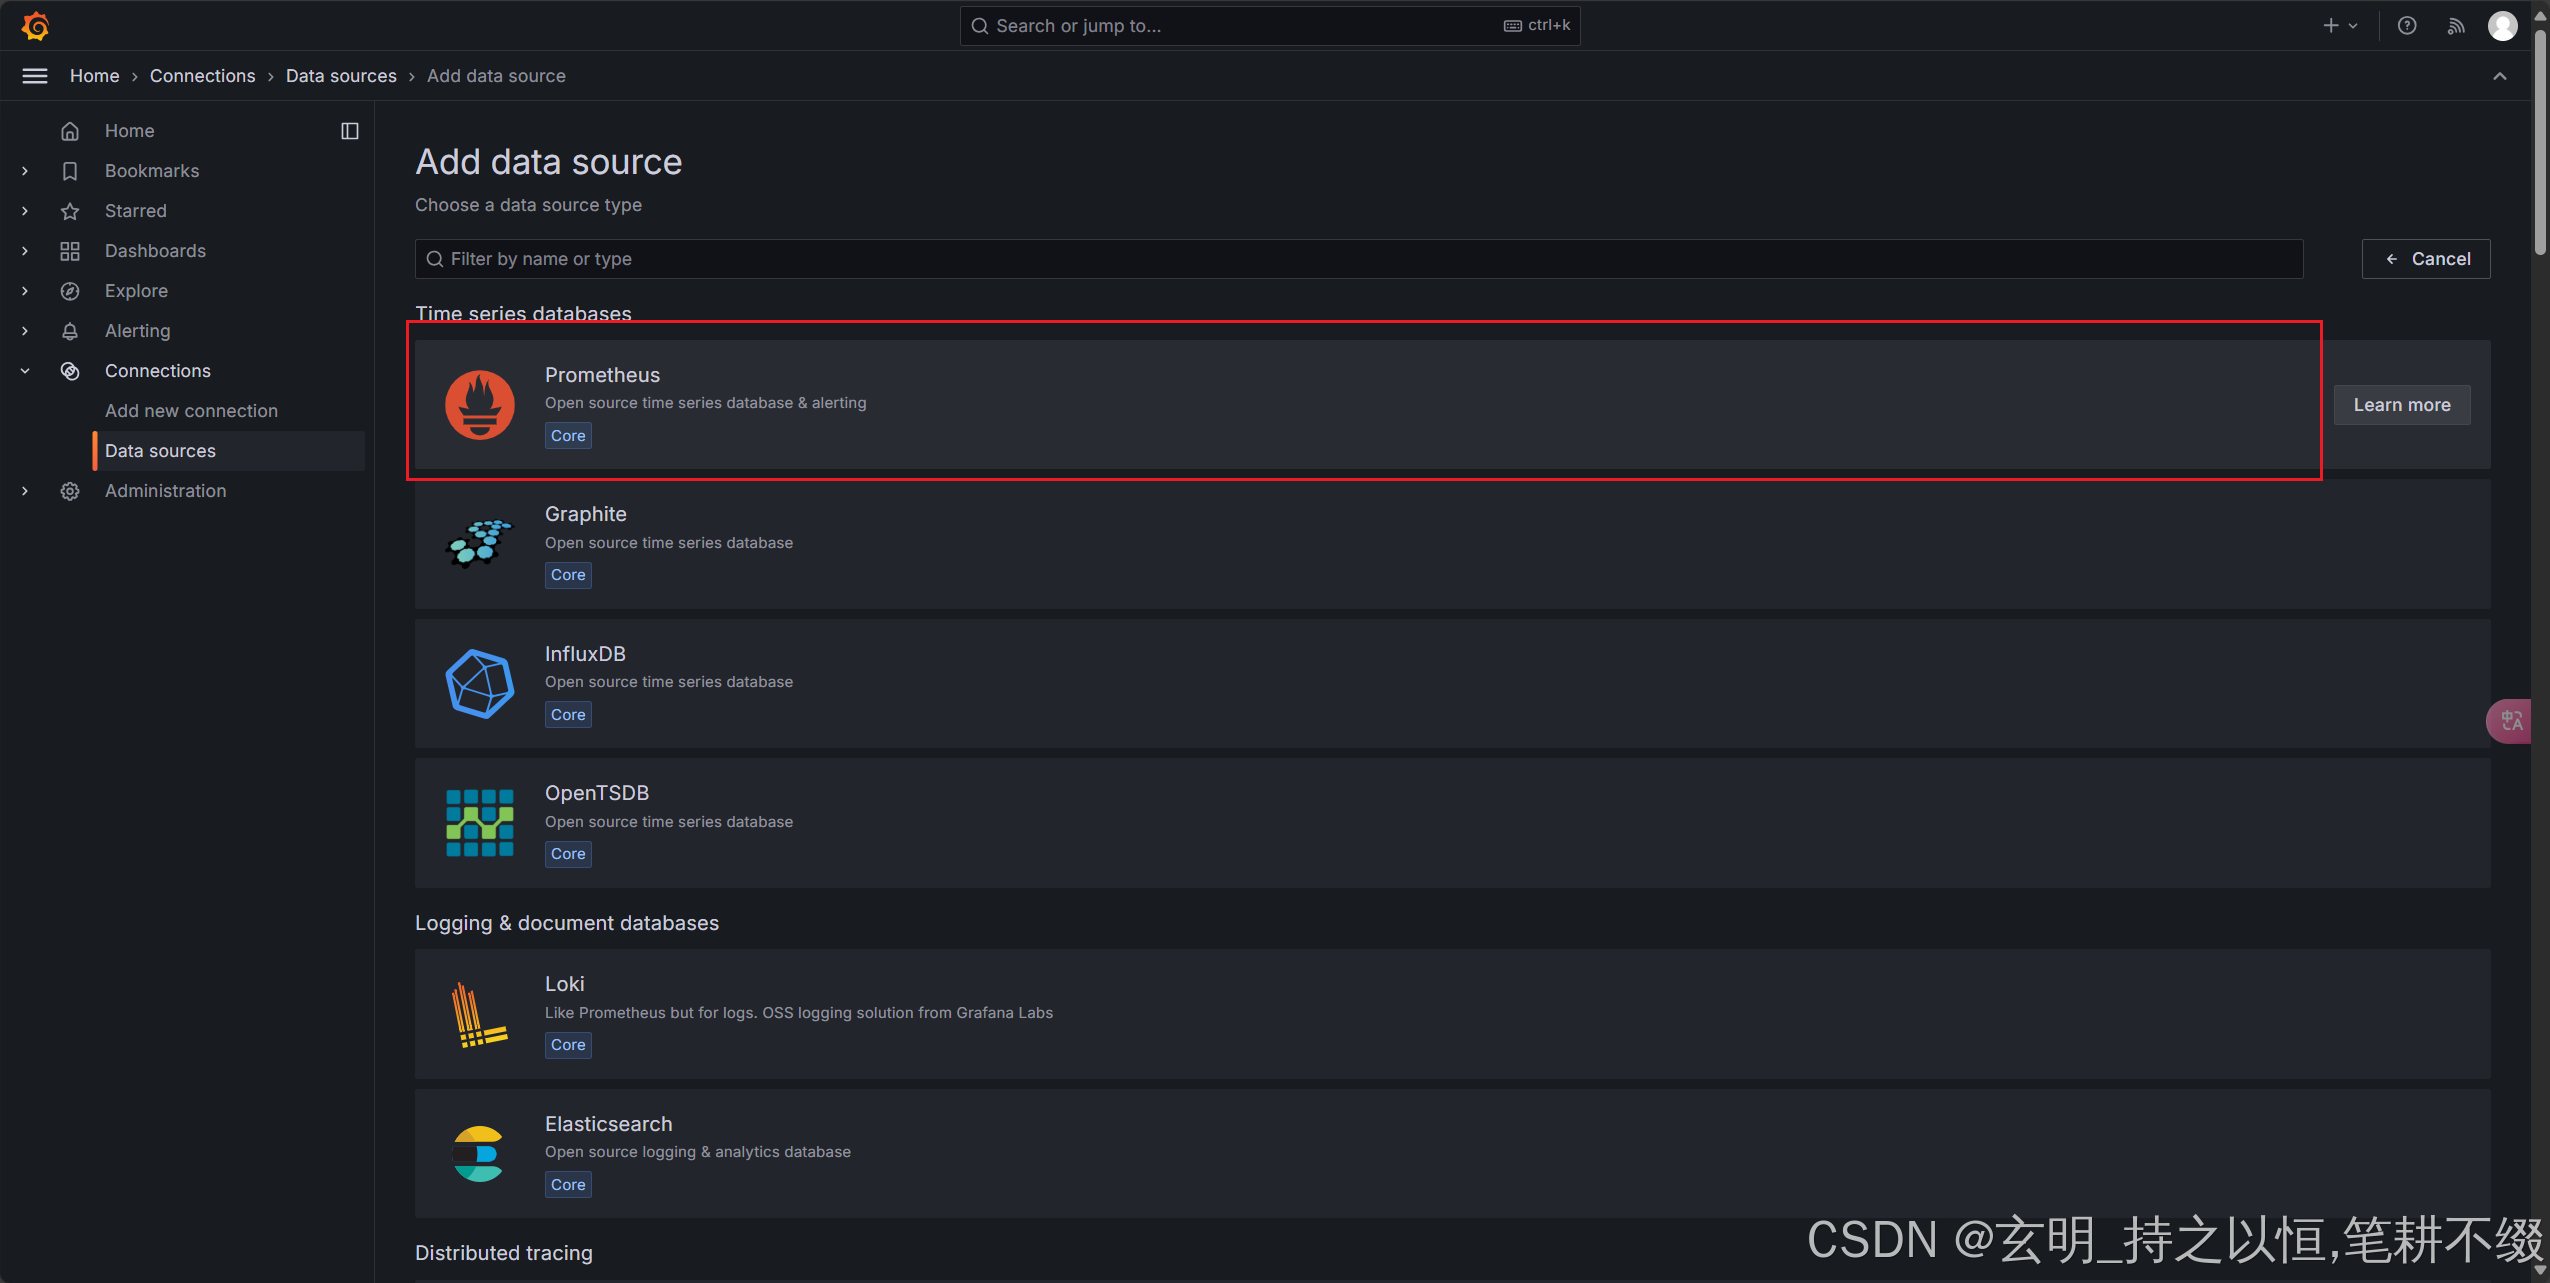
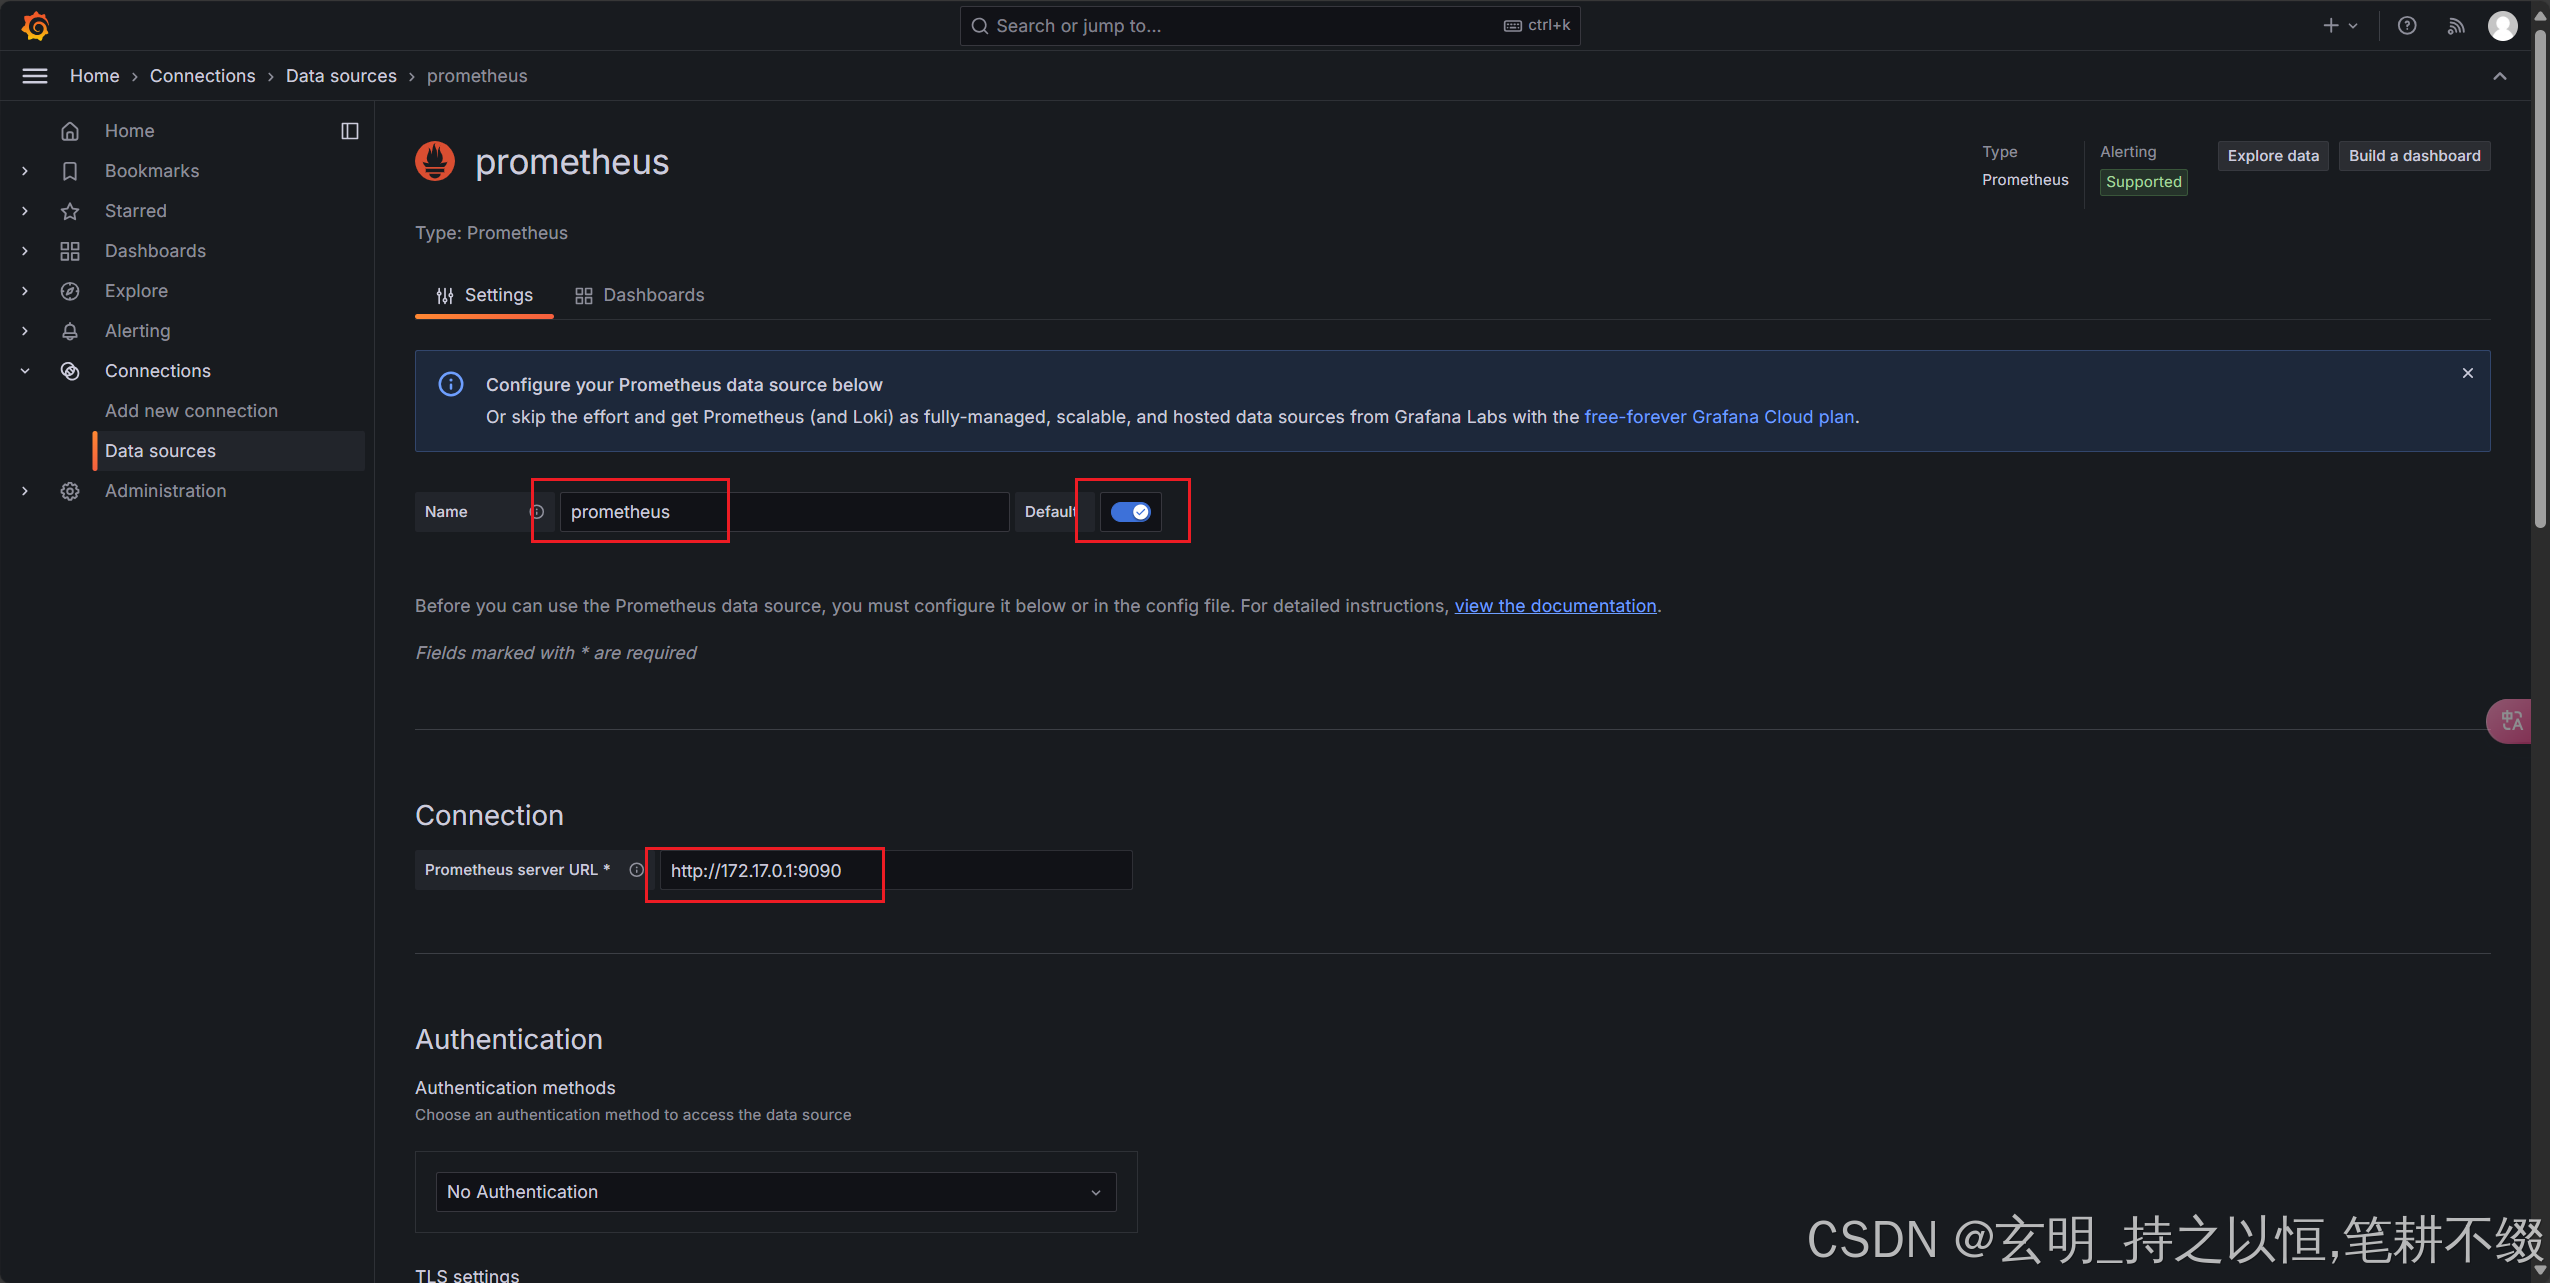
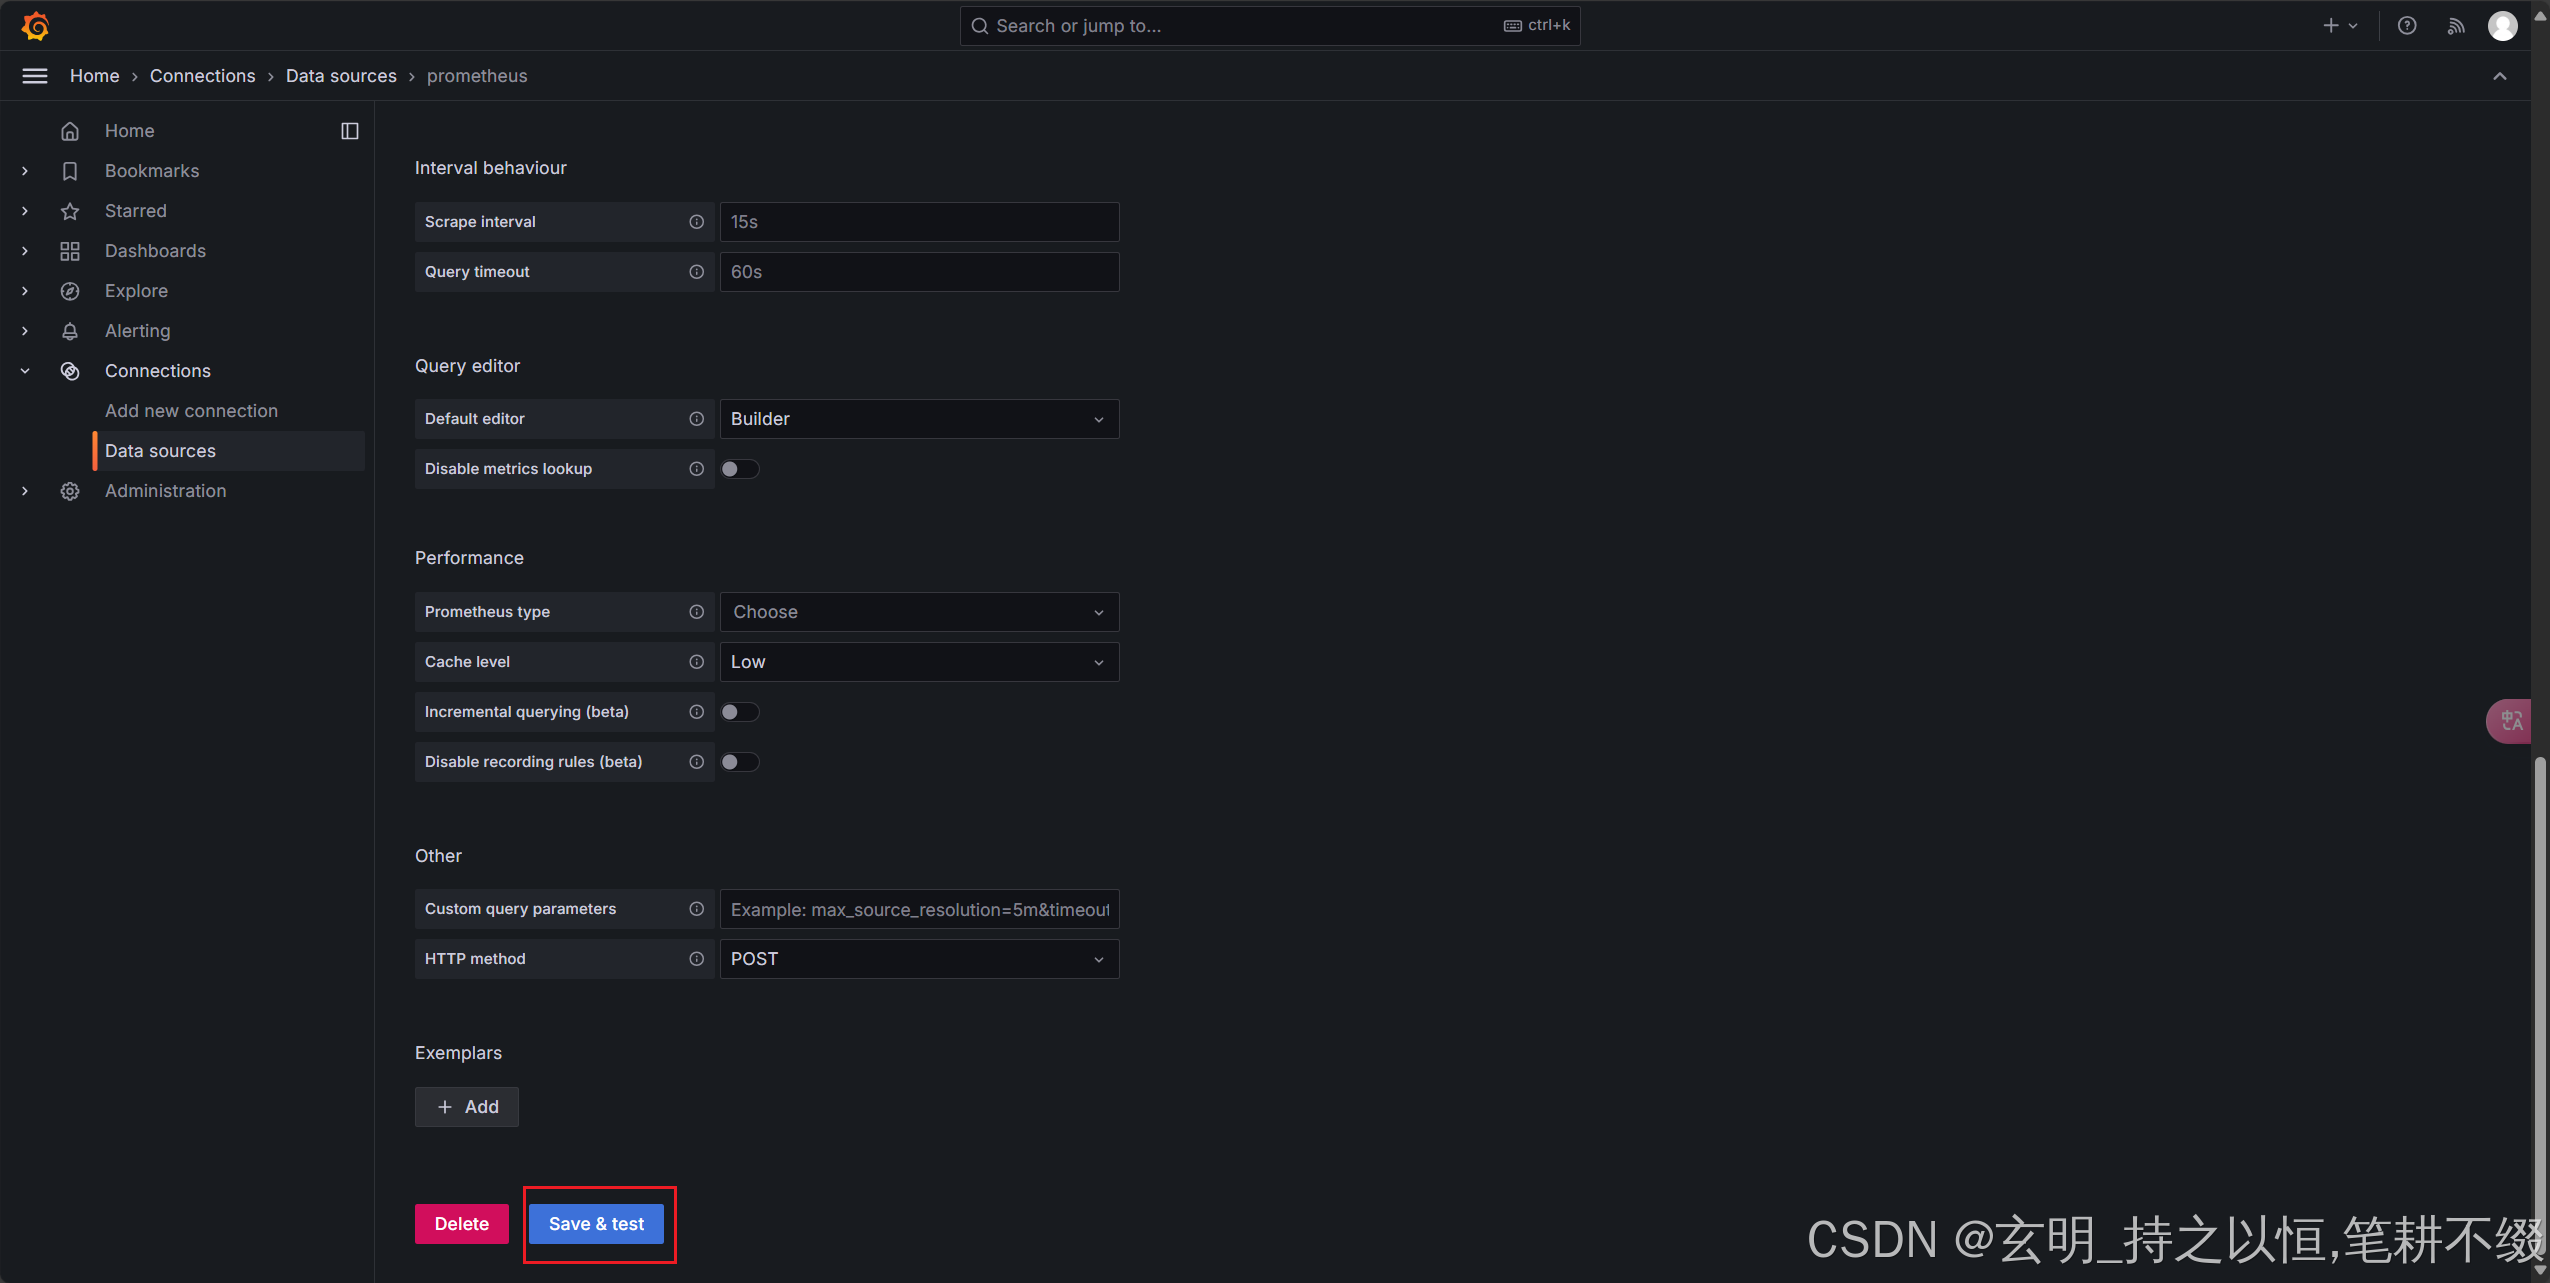
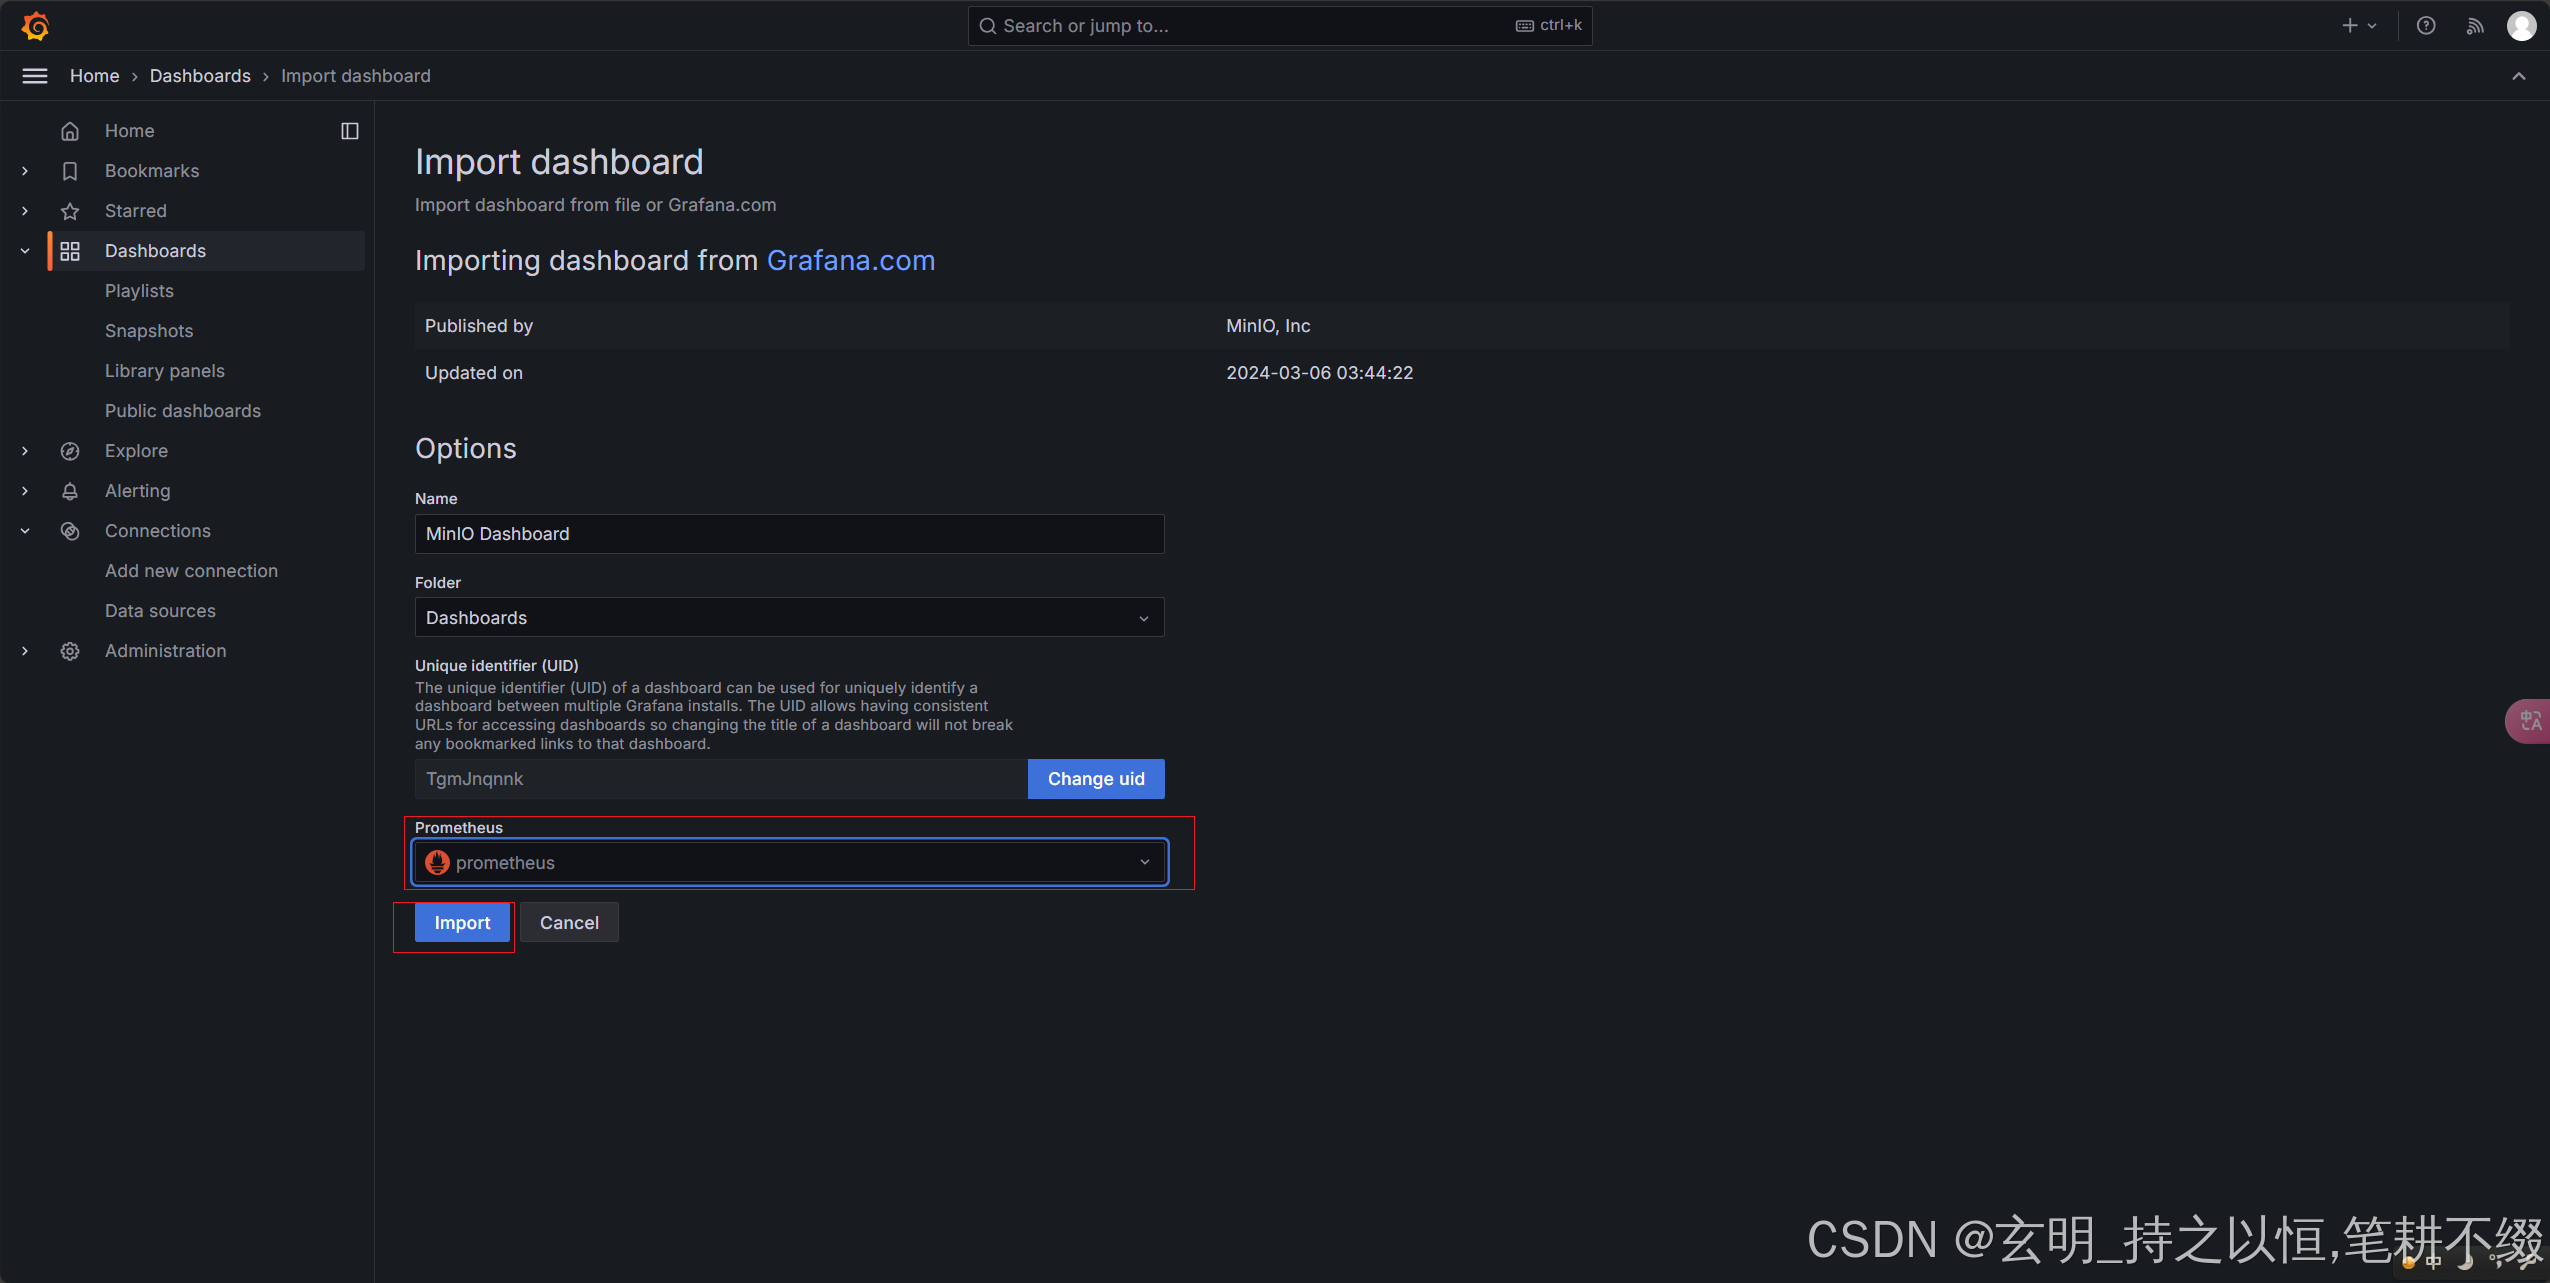
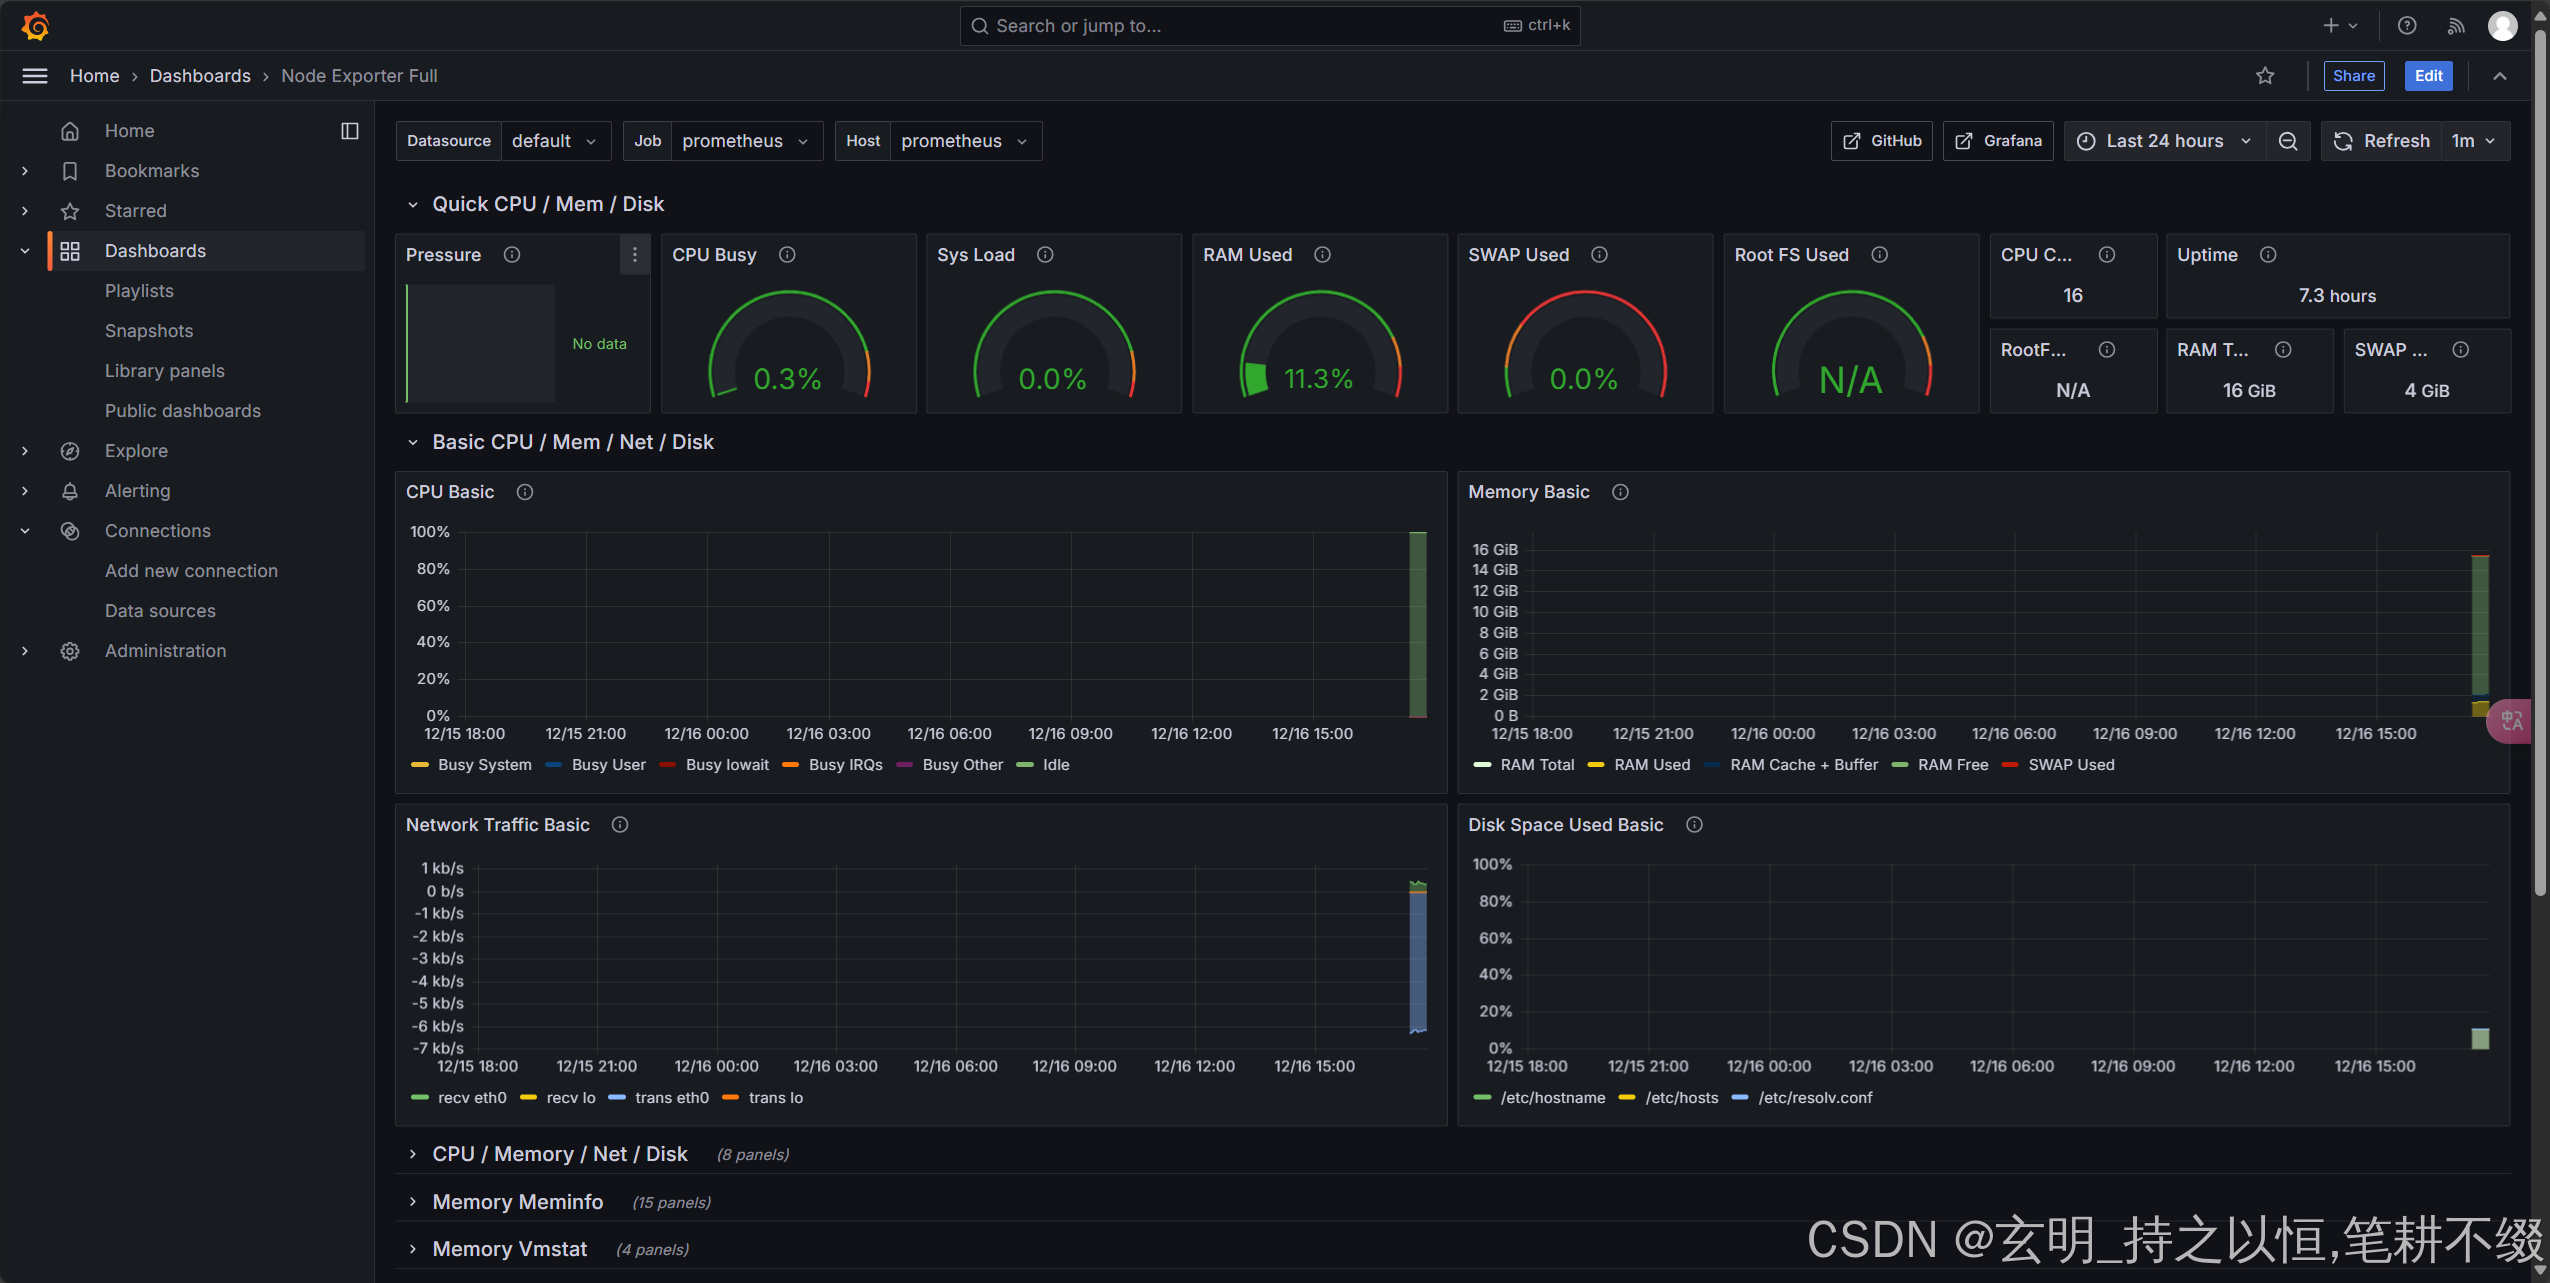
配置prometheus+Grafana
Grafana官方提供模板地址: https://grafana.com/grafana/dashboards
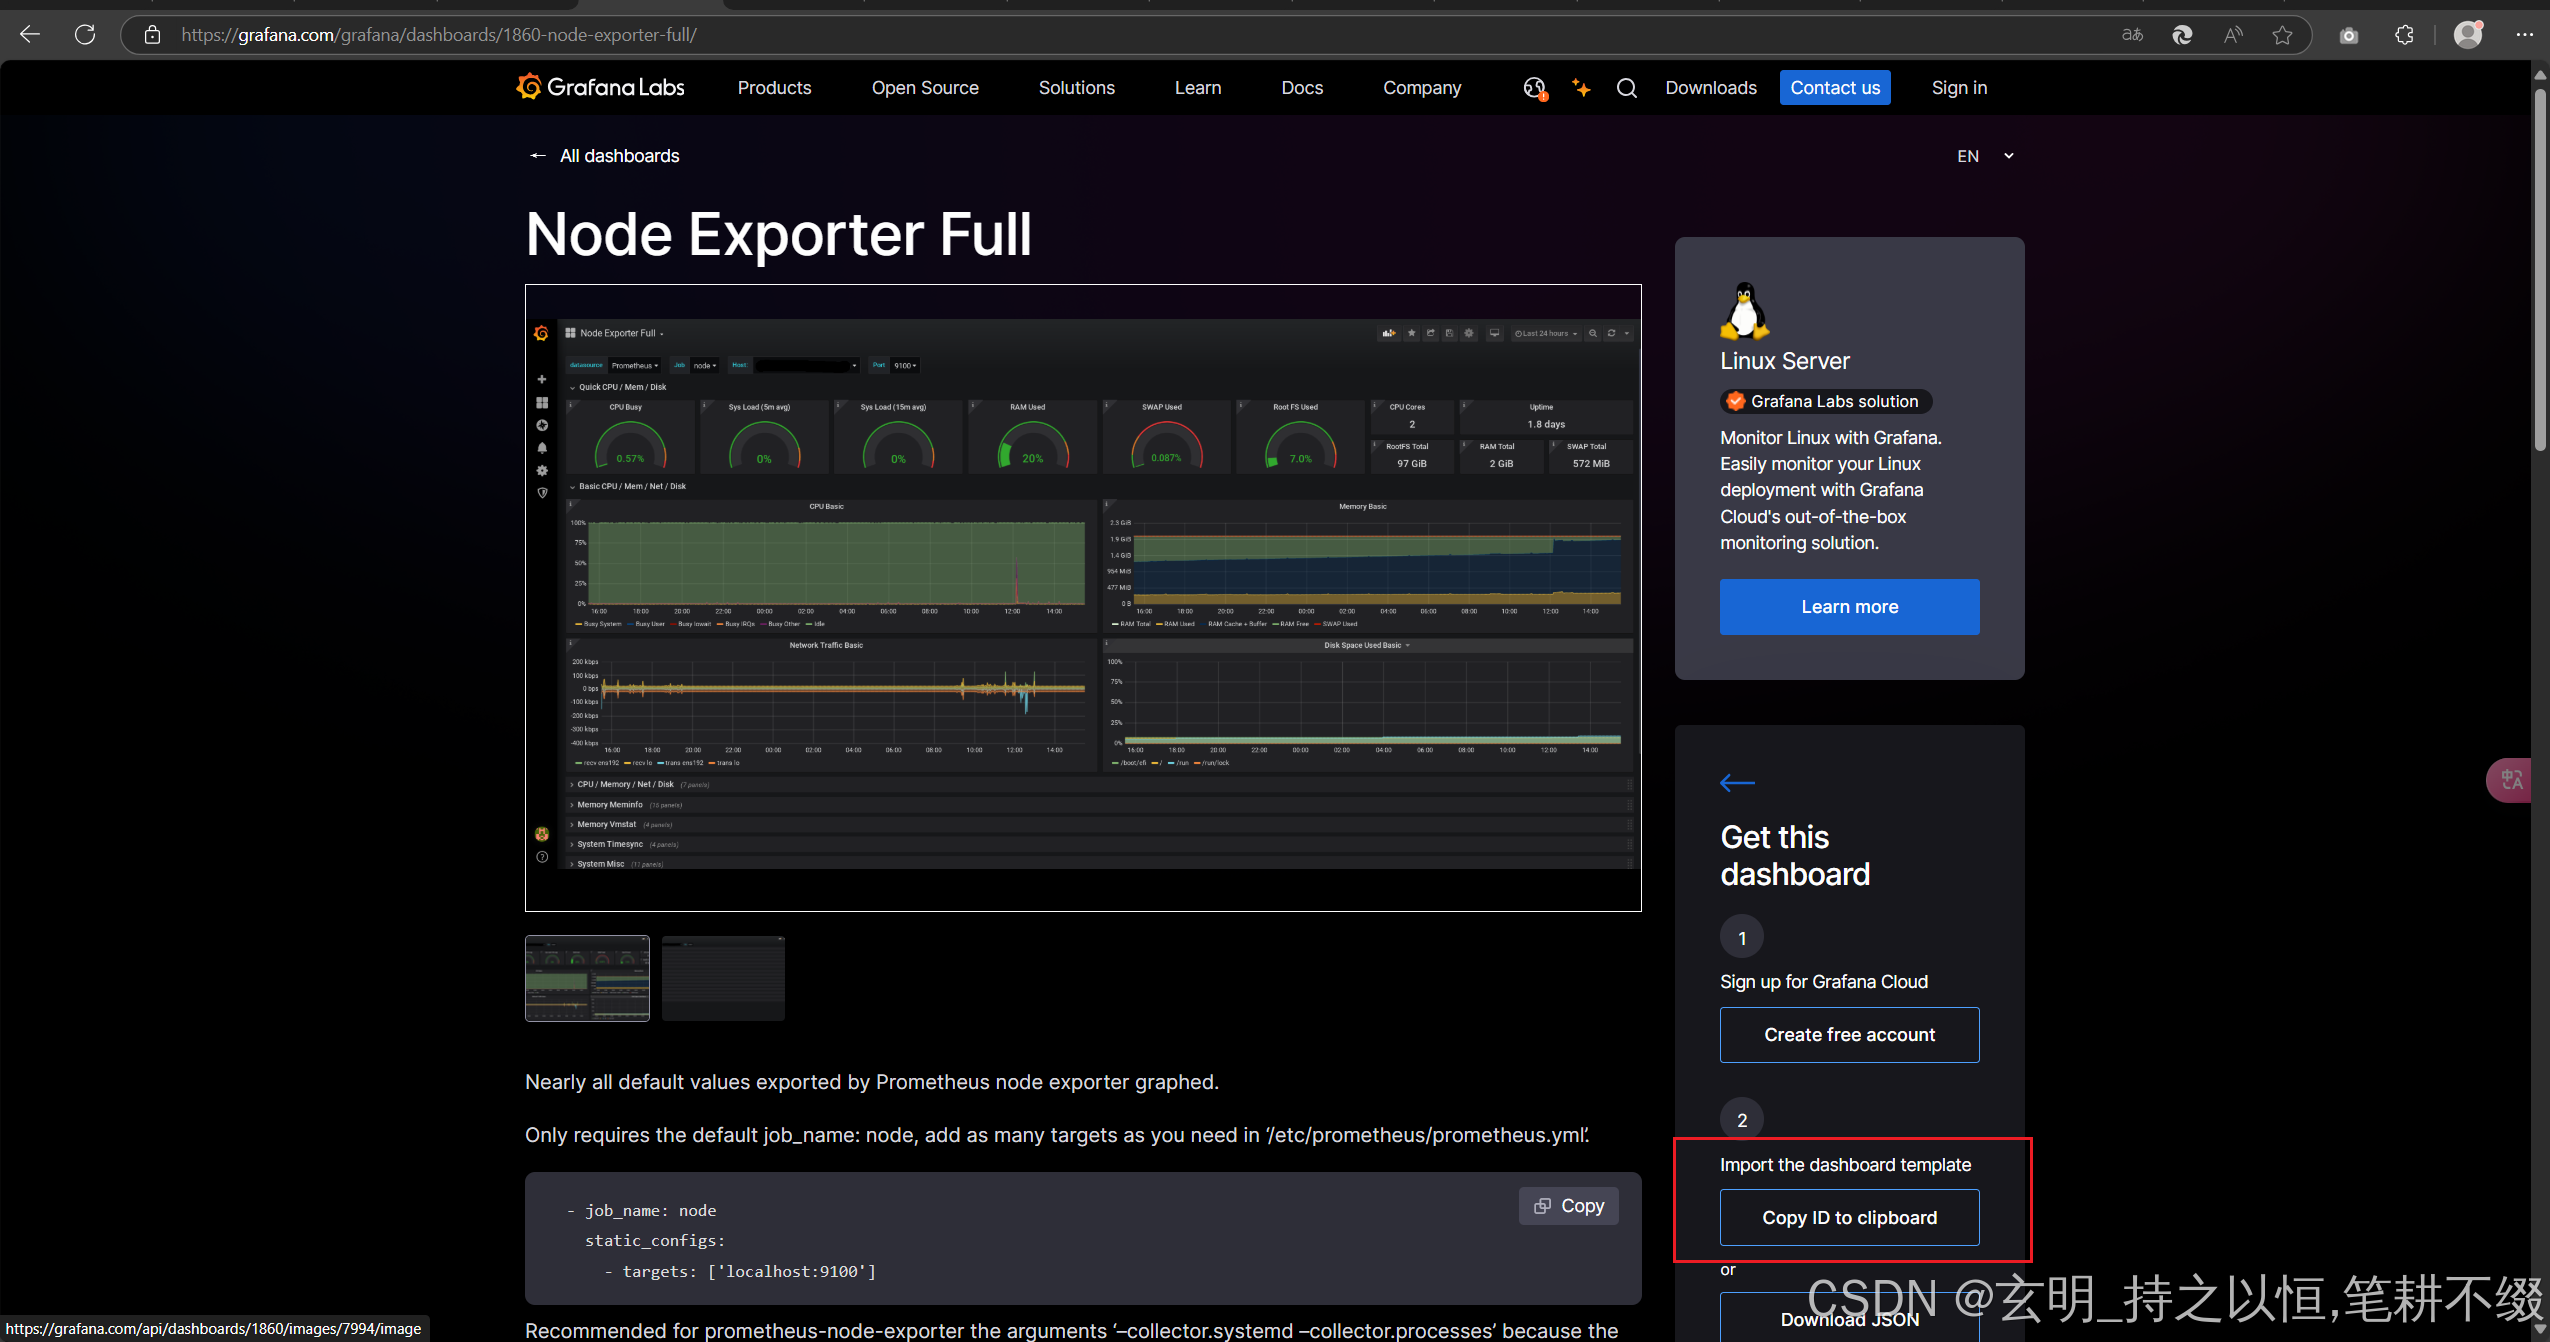
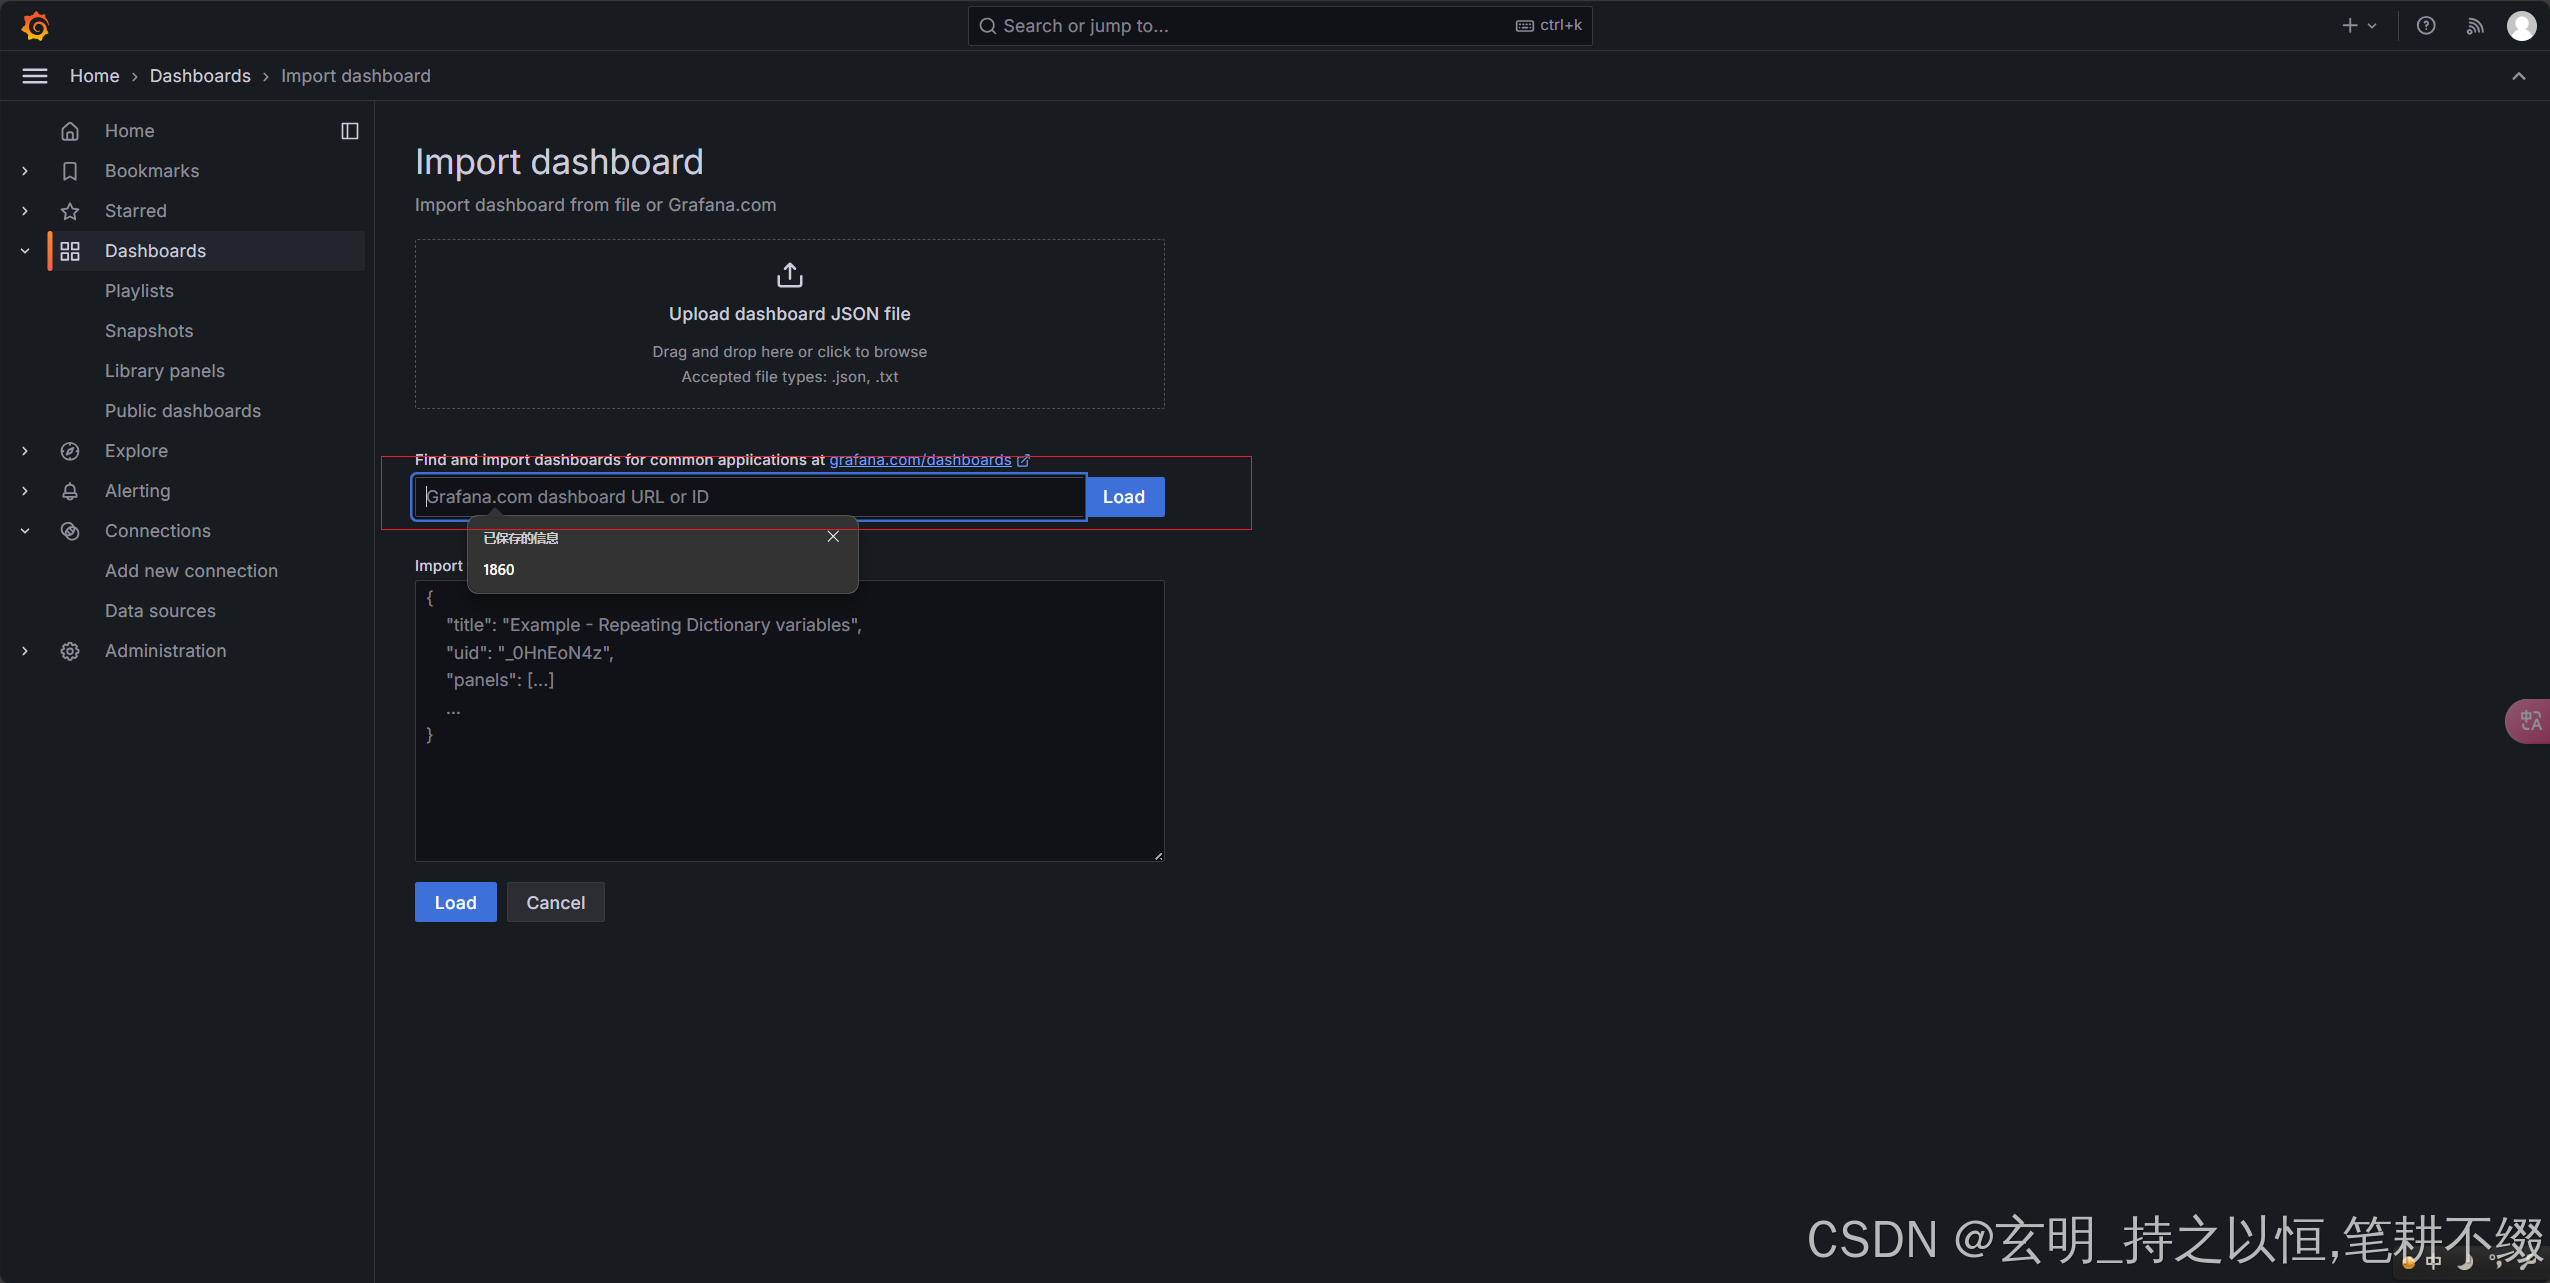
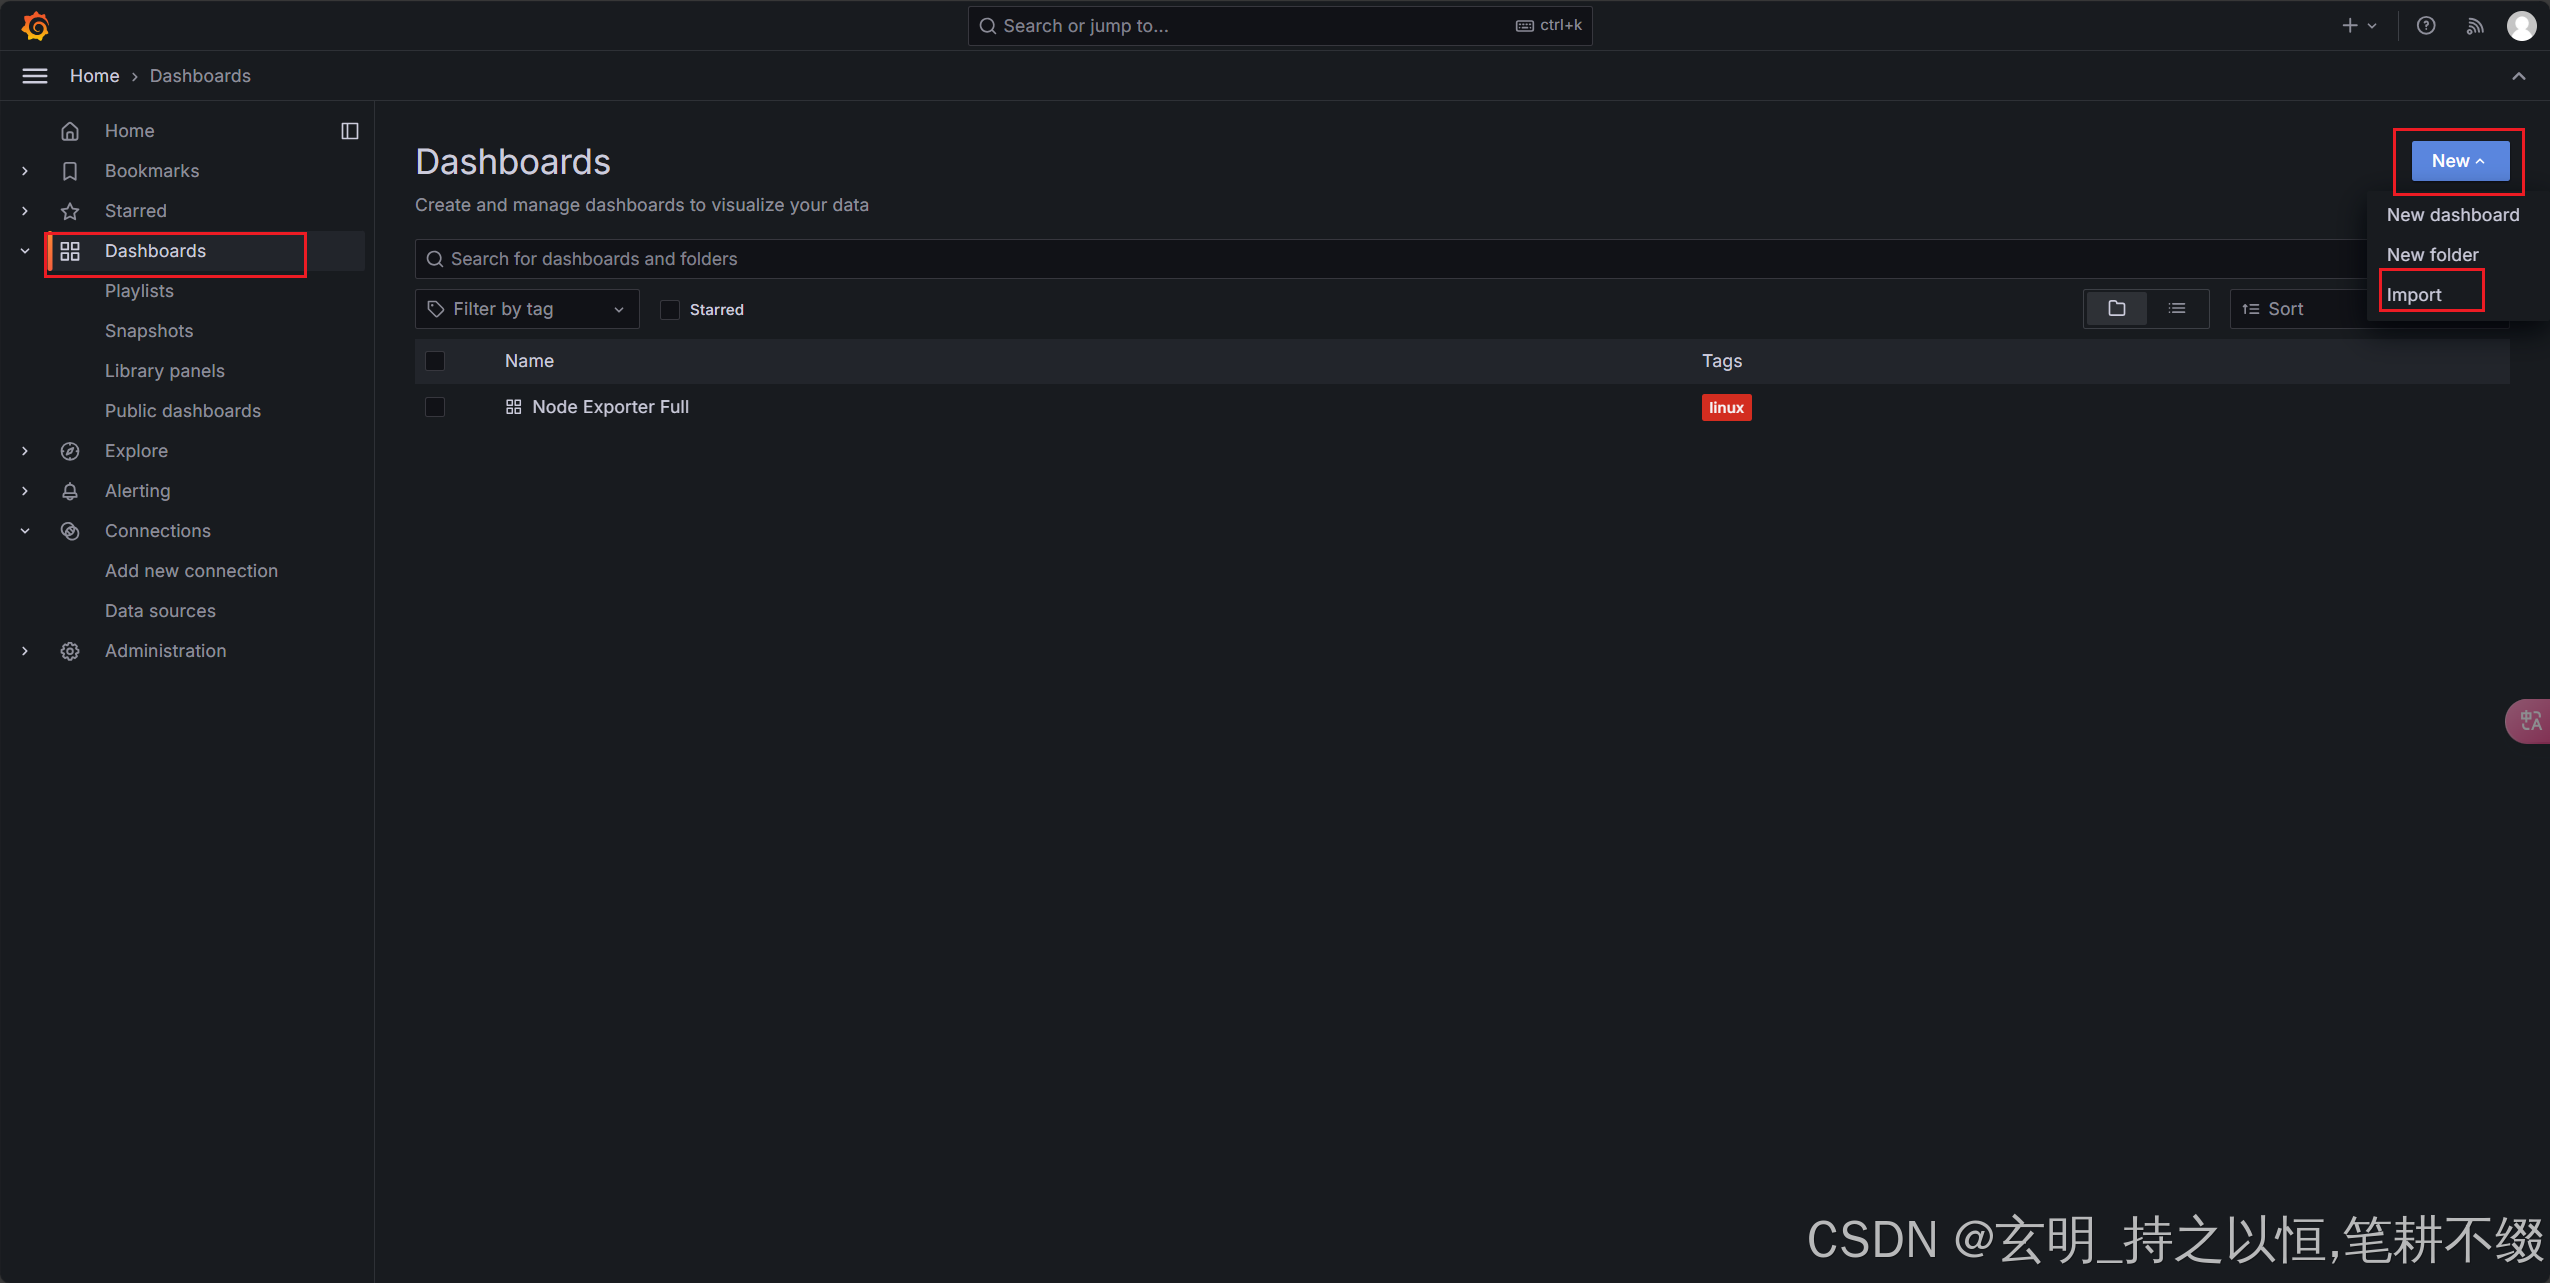

腾讯云面向开发者汇聚海量精品云计算使用和开发经验,营造开放的云计算技术生态圈。
更多推荐
 3
3 0
0- 0


 已为社区贡献3条内容

所有评论(0)