Python数据可视化:pyecharts动态时间线柱状图构建
·
从数据加载到时间线动画的分析理解(醉后有源代码哦!)
(1)
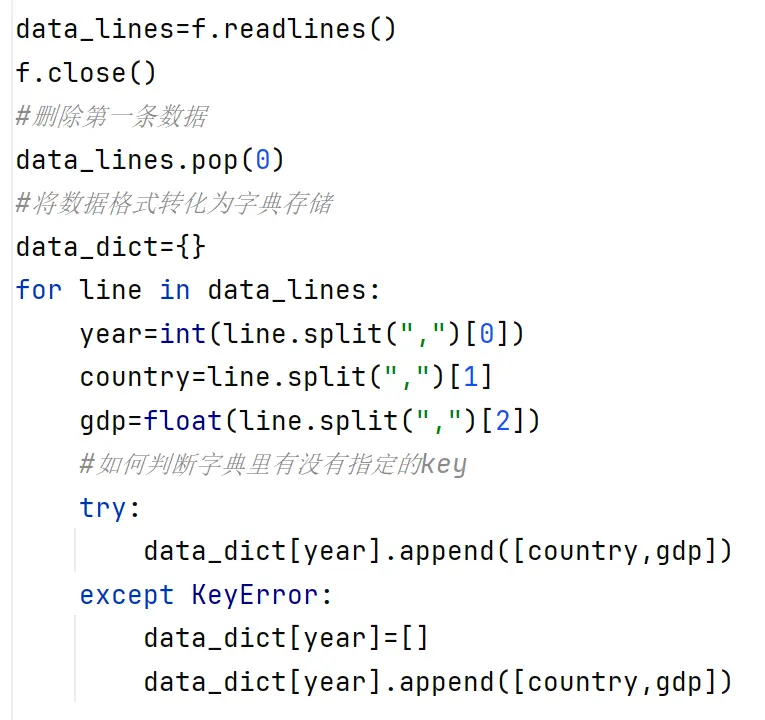
数据容器设计
难点:需要同时处理新键创建和已有键追加
解决方式:使用try-except捕获KeyError
(2)
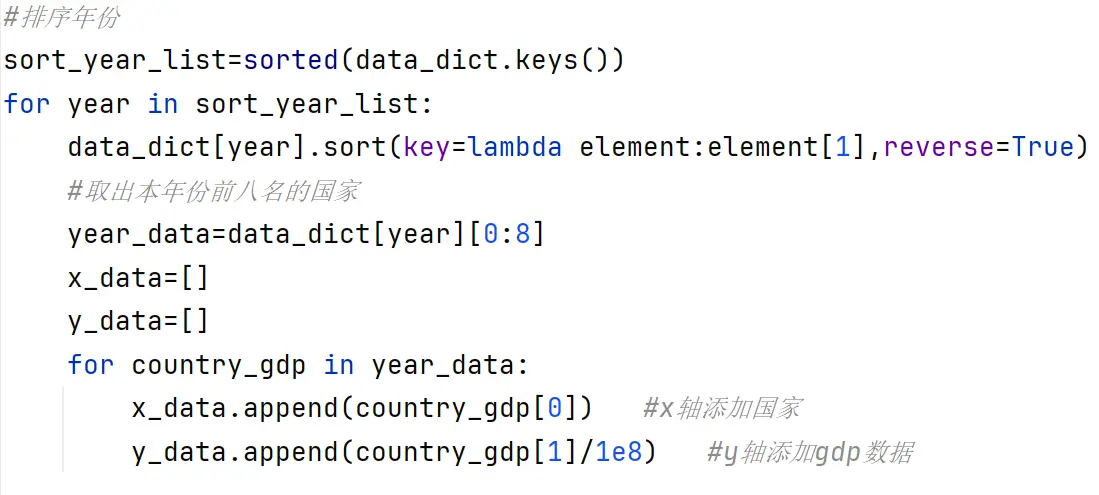
数据处理
重点:在遍历过程中动态修改数据结构和多列表的嵌套处理
(3)
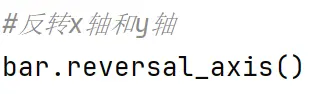
坐标系反转
重点:坐标系反转原理,保持数据正确对应关系
(4)

重点:保留top8国家,按gdp降序排列
(5)
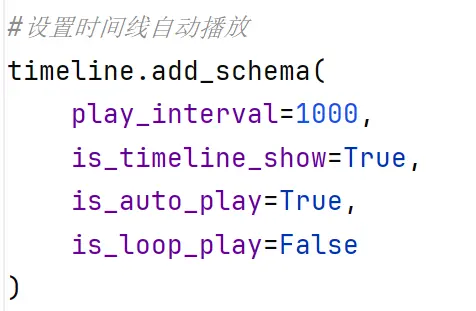
调控画面,实现灵活控制,完善元素,设置时间间隔(1秒切换)
from pyecharts.charts import Bar,Timeline
from pyecharts.options import *
from pyecharts.globals import ThemeType
f=open("D:可视化案例数据/动态柱状图数据/1960-2019全球GDP数据.csv","r",encoding="GB2312")
data_lines=f.readlines()
f.close()
#删除第一条数据
data_lines.pop(0)
#将数据格式转化为字典存储
data_dict={}
for line in data_lines:
    year=int(line.split(",")[0])
    country=line.split(",")[1]
    gdp=float(line.split(",")[2])
    #如何判断字典里有没有指定的key
    try:
        data_dict[year].append([country,gdp])
    except KeyError:
        data_dict[year]=[]
        data_dict[year].append([country,gdp])

#创建时间线对象
timeline=Timeline(
    {"theme":ThemeType.LIGHT}
)

#排序年份
sort_year_list=sorted(data_dict.keys())
for year in sort_year_list:
    data_dict[year].sort(key=lambda element:element[1],reverse=True)
    #取出本年份前八名的国家
    year_data=data_dict[year][0:8]
    x_data=[]
    y_data=[]
    for country_gdp in year_data:
        x_data.append(country_gdp[0])   #x轴添加国家
        y_data.append(country_gdp[1]/1e8)   #y轴添加gdp数据

    #构建柱状图
    bar=Bar()
    x_data.reverse()
    y_data.reverse()
    bar.add_xaxis(x_data)
    bar.add_yaxis("GDP(亿)",y_data,
                  label_opts=LabelOpts(position="right"))
    #反转x轴和y轴
    bar.reversal_axis()
    #设置每一年的图表的标题
    bar.set_global_opts(
        title_opts=TitleOpts(title=f"{year}年全球前8 GDP数据")
    )
    timeline.add(bar,str(year))

#设置时间线自动播放
timeline.add_schema(
    play_interval=1000,
    is_timeline_show=True,
    is_auto_play=True,
    is_loop_play=False
)
#绘图
timeline.render("1960-2019全球GDP前8国家.html")

腾讯云面向开发者汇聚海量精品云计算使用和开发经验,营造开放的云计算技术生态圈。
更多推荐
 9
9 0
0- 0


 已为社区贡献1条内容

所有评论(0)