衣物皮革类 布匹织物瑕疵数据集 2115张,6种瑕疵类型 json格式与yolo格式标签 目标检测 深度学习
YOLOv8训练织物瑕疵检测模型指南 本文详细介绍了如何使用YOLOv8训练一个织物瑕疵检测模型。数据集包含2115张图片,6种瑕疵类型,提供JSON和YOLO格式标签。主要内容包括:环境配置(安装Ultralytics、PyTorch等库)、数据准备(划分训练/验证集、JSON转YOLO格式转换)、EDA分析(类别分布可视化)以及创建YAML配置文件。文章还提供了自动处理脚本,帮助快速完成数据预
如何yolov8训练使用——衣物皮革类 布匹织物瑕疵数据集 2115张,6种瑕疵类型 json格式与yolo格式标签 目标检测 深度学习
,使用YOLOv8训练布匹织物瑕疵数据集。我们将从数据准备、模型训练、评估和可视化等方面详细介绍整个流程。此外,我们还会提供一些常用的自动脚本,帮助你进行数据预处理和探索性数据分析(EDA)。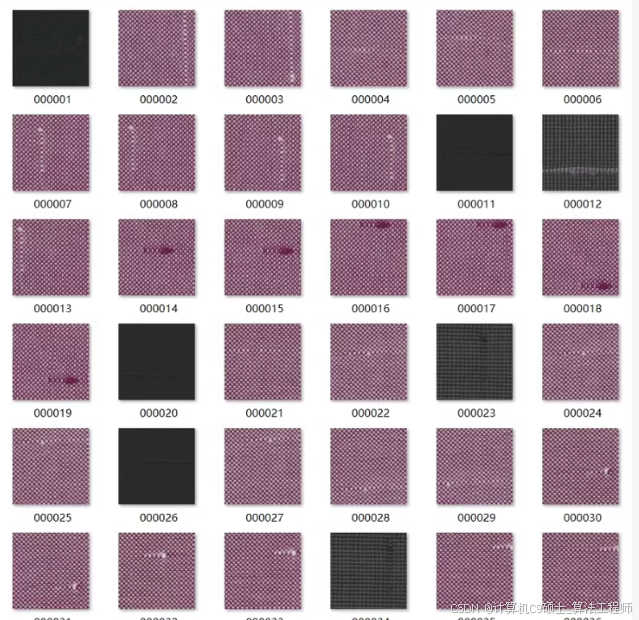
✌欢迎大家点赞、收藏、关注,有感兴趣的选题可以发在评论区~~~✌
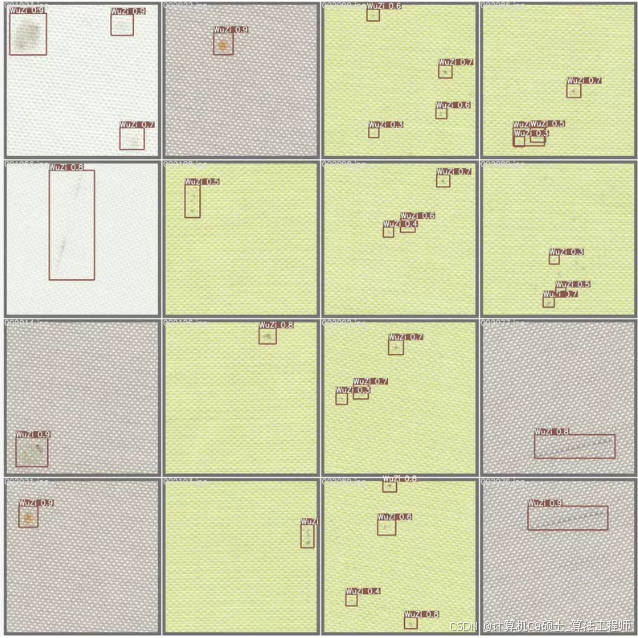
🍅点击查看项目演示 效果演示👇🏻🍅
1. 环境准备
首先,确保你已经安装了必要的库和工具。你可以使用以下命令安装所需的库:
pip install ultralytics
pip install torch torchvision
pip install opencv-python
pip install pandas
pip install matplotlib
pip install scikit-learn
pip install json
2. 数据准备
2.1 数据集目录结构
假设你的数据集目录结构如下:
dataset/
├── images/
│   ├── train/
│   └── val/
└── labels/
    ├── train/
    └── val/
其中,images文件夹包含训练和验证的图像,labels文件夹包含相应的标签文件(YOLO格式的txt文件)。
2.2 自动脚本
2.2.1 随机划分训练集与验证集
import os
import random
import shutil

def split_dataset(image_dir, label_dir, train_ratio=0.8):
    images = os.listdir(image_dir)
    random.shuffle(images)

    train_size = int(len(images) * train_ratio)
    train_images = images[:train_size]
    val_images = images[train_size:]

    train_image_dir = os.path.join(image_dir, 'train')
    val_image_dir = os.path.join(image_dir, 'val')
    train_label_dir = os.path.join(label_dir, 'train')
    val_label_dir = os.path.join(label_dir, 'val')

    os.makedirs(train_image_dir, exist_ok=True)
    os.makedirs(val_image_dir, exist_ok=True)
    os.makedirs(train_label_dir, exist_ok=True)
    os.makedirs(val_label_dir, exist_ok=True)

    for image in train_images:
        shutil.move(os.path.join(image_dir, image), os.path.join(train_image_dir, image))
        label = os.path.splitext(image)[0] + '.txt'
        shutil.move(os.path.join(label_dir, label), os.path.join(train_label_dir, label))

    for image in val_images:
        shutil.move(os.path.join(image_dir, image), os.path.join(val_image_dir, image))
        label = os.path.splitext(image)[0] + '.txt'
        shutil.move(os.path.join(label_dir, label), os.path.join(val_label_dir, label))

# 调用函数
split_dataset('dataset/images', 'dataset/labels')
2.2.2 JSON转YOLO
import json
import os

def convert_json_to_yolo(json_file, image_dir, label_dir):
    with open(json_file, 'r') as f:
        data = json.load(f)

    for image_info in data['images']:
        image_id = image_info['id']
        image_width = image_info['width']
        image_height = image_info['height']
        image_name = image_info['file_name']

        label_file = os.path.join(label_dir, os.path.splitext(image_name)[0] + '.txt')
        with open(label_file, 'w') as f:
            for annotation in data['annotations']:
                if annotation['image_id'] == image_id:
                    category_id = annotation['category_id']
                    bbox = annotation['bbox']
                    x_center = (bbox[0] + bbox[2] / 2) / image_width
                    y_center = (bbox[1] + bbox[3] / 2) / image_height
                    width = bbox[2] / image_width
                    height = bbox[3] / image_height
                    f.write(f"{category_id} {x_center} {y_center} {width} {height}\n")

# 调用函数
convert_json_to_yolo('dataset/annotations.json', 'dataset/images', 'dataset/labels')
2.2.3 EDA和生成散点图
import pandas as pd
import matplotlib.pyplot as plt

def eda_and_scatter_plot(json_file):
    with open(json_file, 'r') as f:
        data = json.load(f)

    categories = {cat['id']: cat['name'] for cat in data['categories']}
    annotations = data['annotations']

    # 统计每个类别的数量
    category_counts = {cat_id: 0 for cat_id in categories}
    for annotation in annotations:
        category_counts[annotation['category_id']] += 1

    # 生成条形图
    plt.bar(categories.values(), category_counts.values())
    plt.xlabel('Category')
    plt.ylabel('Count')
    plt.title('Category Distribution')
    plt.xticks(rotation=45)
    plt.show()

    # 生成散点图
    bbox_sizes = []
    for annotation in annotations:
        bbox = annotation['bbox']
        bbox_sizes.append((bbox[2] * bbox[3], categories[annotation['category_id']]))

    df = pd.DataFrame(bbox_sizes, columns=['Size', 'Category'])
    plt.scatter(df['Category'], df['Size'])
    plt.xlabel('Category')
    plt.ylabel('Bounding Box Size')
    plt.title('Bounding Box Size Distribution')
    plt.xticks(rotation=45)
    plt.show()

# 调用函数
eda_and_scatter_plot('dataset/annotations.json')
✌欢迎大家点赞、收藏、关注,有感兴趣的选题可以发在评论区~~~✌
🍅点击查看项目演示 效果演示👇🏻🍅
3. 创建数据配置文件
YOLOv8需要一个数据配置文件来指定数据集的路径和其他相关信息。创建一个名为fabric_defects.yaml的文件,内容如下:
# Fabric Defects Dataset Configuration

# Path to the dataset directory
path: ./dataset

# Training and validation image directories
train: images/train
val: images/val

# Number of classes
nc: 6

# Class names
names:
  0: 断经
  1: 断纬
  2: 缩纬
  3: 缩经
  4: 擦伤
  5: 污渍
4. 训练模型
使用YOLOv8进行训练非常简单。你可以使用以下命令来启动训练:
yolo train data=fabric_defects.yaml model=yolov8n.pt epochs=100 imgsz=640
解释:
5. 评估模型
训练完成后,你可以使用以下命令来评估模型在验证集上的性能:
yolo val data=fabric_defects.yaml model=runs/detect/train/weights/best.pt imgsz=640
解释:
6. 可视化预测结果
你可以使用以下Python代码来可视化模型的预测结果:
import cv2
import torch
from ultralytics import YOLO

# 加载模型
model = YOLO('runs/detect/train/weights/best.pt')

# 读取图像
image_path = 'dataset/images/val/your_image.jpg'
image = cv2.imread(image_path)

# 进行预测
results = model(image)

# 可视化预测结果
for result in results:
    boxes = result.boxes.xyxy
    confidences = result.boxes.conf
    class_ids = result.boxes.cls

    for box, conf, class_id in zip(boxes, confidences, class_ids):
        x1, y1, x2, y2 = map(int, box)
        label = model.names[int(class_id)]
        confidence = float(conf)

        # 绘制边界框
        cv2.rectangle(image, (x1, y1), (x2, y2), (0, 255, 0), 2)
        text = f'{label}: {confidence:.2f}'
        cv2.putText(image, text, (x1, y1 - 10), cv2.FONT_HERSHEY_SIMPLEX, 0.5, (0, 255, 0), 2)

# 显示图像
cv2.imshow('Prediction', image)
cv2.waitKey(0)
cv2.destroyAllWindows()
7. 总结
以上步骤提供了一个完整的框架,用于使用YOLOv8训练布匹织物瑕疵数据集。代码包括数据准备、模型训练、评估和结果可视化等多个步骤。
✌欢迎大家点赞、收藏、关注,有感兴趣的选题可以发在评论区~~~✌
🍅点击查看项目演示 效果演示👇🏻🍅

腾讯云面向开发者汇聚海量精品云计算使用和开发经验,营造开放的云计算技术生态圈。
更多推荐
 5
5 0
0- 0


 已为社区贡献13条内容

所有评论(0)