傅里叶变换(Fourier Transform, FT)是一种强大的数学工具,用于将时间域信号转换为频域信号,广泛应用于信号处理、数据分析和可视化等领域
在你的示波器多通道数据处理场景(SetMultiChannelViewData 方法,处理 List<double> times 和 SortedDictionary<int, List<double>> lst 数据),傅里叶变换可用于分析漏电流(LEAKOSC)数据的频率成分、去除噪声或提取周期性特征,从而优化图表显示。5. 优化建议为提升傅里叶变换在你的示波器数据处理中的效果,以下是优化建议
傅里叶变换(Fourier Transform, FT)是一种强大的数学工具,用于将时间域信号转换为频域信号,广泛应用于信号处理、数据分析和可视化等领域。在你的示波器多通道数据处理场景(SetMultiChannelViewData 方法,处理 List<double> times 和 SortedDictionary<int, List<double>> lst 数据),傅里叶变换可用于分析漏电流(LEAKOSC)数据的频率成分、去除噪声或提取周期性特征,从而优化图表显示。以下是傅里叶变换的原理、在示波器数据中的应用方法、代码实现,以及与你的代码集成的建议,附带中文解释。
1. 傅里叶变换原理核心思想:
- 傅里叶变换将时间域信号 ( x(t) ) 转换为频域信号 ( X(f) ),表示信号在不同频率上的幅度和相位。
- 离散傅里叶变换(DFT)适用于离散时间序列(如你的 lst[id] 数据),快速傅里叶变换(FFT)是 DFT 的高效实现。
数学公式:
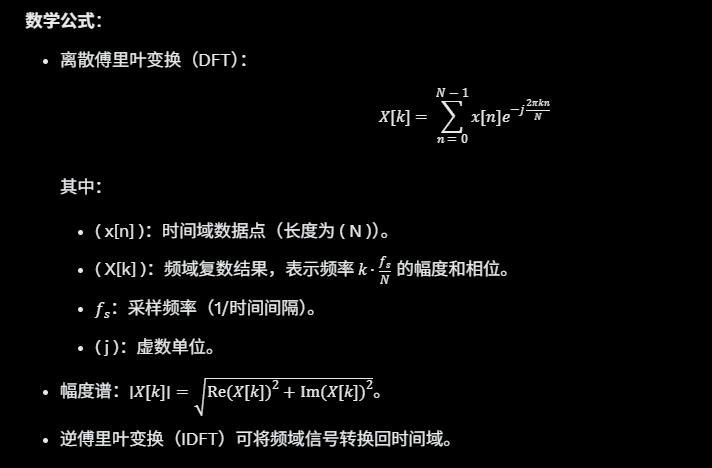
- 应用场景:
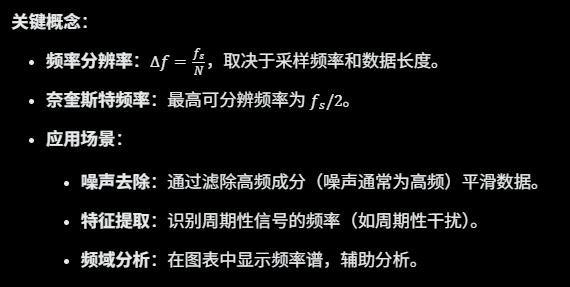
- 噪声去除:通过滤除高频成分(噪声通常为高频)平滑数据。
- 特征提取:识别周期性信号的频率(如周期性干扰)。
- 频域分析:在图表中显示频率谱,辅助分析。
适用性:
- 你的漏电流数据(lst[id])是时间序列,可能包含周期性噪声或测量误差。
- 傅里叶变换适合分析这些数据的频率特性,平滑噪声或提取周期性模式,优化示波器图表显示。
2. 傅里叶变换在示波器数据中的应用在你的场景中,傅里叶变换可用于以下目的:
- 噪声去除(低通滤波):
- 漏电流数据可能包含高频噪声(如测量抖动)。
- 通过傅里叶变换,滤除高频成分,保留低频趋势,生成平滑曲线。
- 频率分析:
- 分析数据中的周期性成分(如电源干扰的 50/60Hz)。
- 可在图表中显示幅度谱,帮助用户识别频率特征。
- 数据压缩:
- 仅保留主要频率分量,减少数据点数,优化渲染性能。
挑战:
- 需要确定采样频率(由 times 的时间间隔计算)。
- 边界效应可能影响频域分析。
- 数据长度需为 2 的幂以优化 FFT 性能。
3. 实现方法傅里叶变换实现通常依赖 FFT 算法,推荐使用数值计算库(如 MathNet.Numerics)以简化代码。以下是基于 MathNet.Numerics 的实现,包含低通滤波和平滑功能。安装 MathNet.Numerics:bash
dotnet add package MathNet.Numerics3.1 低通滤波(平滑噪声)通过傅里叶变换滤除高频成分,生成平滑数据。代码:csharp
using MathNet.Numerics.IntegralTransforms;

List<double> SmoothFourierLowPass(List<double> data, double sampleRate, double cutoffFrequency)
{
    if (data == null || data.Count < 2 || sampleRate <= 0 || cutoffFrequency <= 0)
    {
        Debug.WriteLine("Invalid parameters for Fourier low-pass filter");
        return new List<double>(data);
    }

    // 确保数据长度为 2 的并(优化 FFT 性能)
    int n = MathNet.Numerics.MathFunctions.NextPowerOfTwo(data.Count);
    var paddedData = new double[n];
    for (int i = 0; i < data.Count; i++) paddedData[i] = data[i];
    for (int i = data.Count; i < n; i++) paddedData[i] = 0; // 零填充

    // 转换为复数数组
    var complexData = paddedData.Select(x => new System.Numerics.Complex(x, 0)).ToArray();

    // 傅里叶变换
    Fourier.Forward(complexData, FourierOptions.Default);

    // 计算频率步长
    double frequencyStep = sampleRate / n;
    int cutoffIndex = (int)(cutoffFrequency / frequencyStep);

    // 滤除高频成分
    for (int i = cutoffIndex; i < n - cutoffIndex; i++)
    {
        complexData[i] = 0; // 高频置零
    }

    // 逆傅里叶变换
    Fourier.Inverse(complexData, FourierOptions.Default);

    // 提取实部
    var smoothed = complexData.Take(data.Count).Select(c => c.Real / n).ToList();
    return smoothed;
}
说明:
- sampleRate:采样频率(Hz),由 times 的时间间隔计算(如 1 / (times[1] - times[0]))。
- cutoffFrequency:截止频率,滤除高于此频率的成分(需根据数据特性调整)。
- 零填充到 2 的幂提高 FFT 效率。
- 结果为平滑后的时间域数据,噪声减少。
3.2 频率分析(生成幅度谱)生成频域幅度谱,用于分析周期性特征。代码:csharp
using MathNet.Numerics.IntegralTransforms;

(double[] frequencies, double[] amplitudes) GetAmplitudeSpectrum(List<double> data, double sampleRate)
{
    if (data == null || data.Count < 2 || sampleRate <= 0)
    {
        return (new double[0], new double[0]);
    }

    int n = MathNet.Numerics.MathFunctions.NextPowerOfTwo(data.Count);
    var paddedData = new double[n];
    for (int i = 0; i < data.Count; i++) paddedData[i] = data[i];

    var complexData = paddedData.Select(x => new System.Numerics.Complex(x, 0)).ToArray();
    Fourier.Forward(complexData, FourierOptions.Default);

    // 计算幅度谱
    var amplitudes = complexData.Take(n / 2).Select(c => c.Magnitude / n).ToArray();
    var frequencies = Enumerable.Range(0, n / 2).Select(i => i * sampleRate / n).ToArray();

    return (frequencies, amplitudes);
}
说明:
- 返回频率和对应的幅度谱,仅取正频率(( 0 ) 到
fs/2
)。 - 可用于绘制频域图表,分析周期性干扰。
4. 集成到 SetMultiChannelViewData以下是将傅里叶变换低通滤波集成到你的方法的代码,平滑漏电流数据并优化图表显示。代码:csharp
private void SetMultiChannelViewData(List<double> times_src, object obj2, Oscilloscope oscilloscope)
{
    if (times_src == null || times_src.Count < 2 || obj2 == null)
    {
        Debug.WriteLine("Error: Invalid input data");
        return;
    }

    string ChartType = oscilloscope.Name.Split('-')[1];
    double MultiMaxY = double.MinValue;
    double MultiMinY = double.MaxValue;
    oscilloscope.LoadingData = true;
    List<double> times = new List<double>(times_src);
    SortedDictionary<int, List<double>> ls = obj2 as SortedDictionary<int, List<double>>;
    SortedDictionary<int, List<double>> lst = new SortedDictionary<int, List<double>>();

    // 计算采样频率
    double sampleRate = 1.0 / (times[1] - times[0]); // 假设时间间隔均匀
    double cutoffFrequency = 100.0; // 截止频率(Hz),需根据数据调整

    // 数据复制和平滑
    foreach (int id in ls.Keys)
    {
        if (PosIndexList.Contains(id))
        {
            lst.Add(id, SmoothFourierLowPass(ls[id], sampleRate, cutoffFrequency));
        }
    }

    if (oscilloscope.PosNameRelation != SelectControlTestUnitSelecter.TestChannel.Bib.BIBCoords)
    {
        oscilloscope.PosNameRelation = SelectControlTestUnitSelecter.TestChannel.Bib.BIBCoords;
    }

    if (oscilloscope.Channels.Count == 0)
    {
        SetReatangleProps(SelectControlTestUnitSelecter.TestChannel.Id);
        SetOscopeChannels(ChartType);
    }

    string unit = DataTimeConvertor.AutoConvertByTime(times[times.Count - 1], out double t_unit);
    string yUnit = "";
    double yScale = 1;

    if (oscilloscope.Channels.Count > 0)
    {
        foreach (Channel c in oscilloscope.Channels)
        {
            int J = int.Parse(c.ChannelProps.Legend);
            if (lst.ContainsKey(J) && lst[J].Count > 0)
            {
                double CacheMaxY = lst[J].Max();
                double CacheMinY = lst[J].Min();
                MultiMaxY = Math.Max(MultiMaxY, CacheMaxY);
                MultiMinY = Math.Min(MultiMinY, CacheMinY);
            }
        }

        if (MultiMaxY == MultiMinY)
        {
            MultiMaxY = MultiMinY + 0.1 * Math.Abs(MultiMinY);
        }

        double range = Math.Abs(MultiMaxY - MultiMinY);
        double padding = range == 0 ? Math.Abs(MultiMaxY) * 0.1 : range * 0.2;
        double yMax = MultiMaxY + padding;
        double yMin = MultiMinY - padding;
        if (yMax < yMin)
        {
            double temp = yMax;
            yMax = yMin;
            yMin = temp;
        }

        if (ChartType == "LEAKOSC")
        {
            yUnit = DataTimeConvertor.AutoConvertByIc(MultiMaxY, out double maxYvalue, out yScale);
            oscilloscope.FE = RuntimeConfiguration.ICConvert == "Scientific";
        }

        oscilloscope.BeginUpdate();
        try
        {
            foreach (Channel c in oscilloscope.Channels)
            {
                int J = int.Parse(c.ChannelProps.Legend);
                if (lst.ContainsKey(J) && lst[J].Count != 0)
                {
                    c.Clear();
                    c.ChangeAxisXUnit(t_unit);
                    if (ChartType == "LEAKOSC")
                    {
                        c.ChangeAxisYUnit(yScale);
                    }
                    c.Add(times, lst[J]);
                    c.SetXAxisLimit(times[times.Count - 1], times[0], 0);
                    c.SetYAxisLimit(yMax, yMin, 0);
                }
            }
        }
        finally
        {
            oscilloscope.EndUpdate();
        }
    }

    if (ChartType == "LEAKOSC")
    {
        oscilloscope.YLabel = $"Leakage [{yUnit}]";
    }
    oscilloscope.XLabel = $"Time [{unit}]";
}

// 傅里叶低通滤波
List<double> SmoothFourierLowPass(List<double> data, double sampleRate, double cutoffFrequency)
{
    if (data == null || data.Count < 2 || sampleRate <= 0 || cutoffFrequency <= 0)
    {
        return new List<double>(data);
    }

    int n = MathNet.Numerics.MathFunctions.NextPowerOfTwo(data.Count);
    var paddedData = new double[n];
    for (int i = 0; i < data.Count; i++) paddedData[i] = data[i];

    var complexData = paddedData.Select(x => new System.Numerics.Complex(x, 0)).ToArray();
    Fourier.Forward(complexData, FourierOptions.Default);

    double frequencyStep = sampleRate / n;
    int cutoffIndex = (int)(cutoffFrequency / frequencyStep);
    for (int i = cutoffIndex; i < n - cutoffIndex; i++)
    {
        complexData[i] = 0;
    }

    Fourier.Inverse(complexData, FourierOptions.Default);
    return complexData.Take(data.Count).Select(c => c.Real / n).ToList();
}
说明:
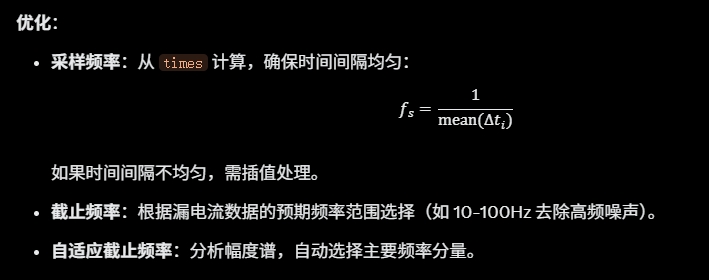
- 计算 sampleRate 假设时间间隔均匀(times[1] - times[0])。
- cutoffFrequency 需根据数据特性调整(建议从 10Hz 至 100Hz 测试)。
- 平滑后的数据存储在 lst[id],直接用于图表渲染。
- 使用 BeginUpdate 和 EndUpdate 优化渲染性能。
5. 优化建议为提升傅里叶变换在你的示波器数据处理中的效果,以下是优化建议:5.1 采样频率和截止频率调优问题:采样频率和截止频率直接影响滤波效果,需根据数据特性设置。
代码示例(计算采样频率):csharp
double CalculateSampleRate(List<double> times)
{
    if (times.Count < 2) return 1.0;
    double sumIntervals = 0;
    for (int i = 1; i < times.Count; i++)
    {
        sumIntervals += times[i] - times[i - 1];
    }
    return times.Count / sumIntervals;
}

// 在 SetMultiChannelViewData 中
double sampleRate = CalculateSampleRate(times);
double cutoffFrequency = 50.0; // 调整为合适值
5.2 边界效应处理问题:傅里叶变换假设信号周期性,边界可能引入伪影。优化:
- 窗口函数:在 FFT 前应用窗函数(如汉宁窗)减少边界效应。
- 数据镜像:在数据两端镜像扩展,模拟周期性。
代码示例(汉宁窗):csharp
List<double> ApplyHanningWindow(List<double> data)
{
    var windowed = new List<double>();
    int n = data.Count;
    for (int i = 0; i < n; i++)
    {
        double window = 0.5 * (1 - Math.Cos(2 * Math.PI * i / (n - 1)));
        windowed.Add(data[i] * window);
    }
    return windowed;
}

// 在 SmoothFourierLowPass 中
var windowedData = ApplyHanningWindow(data);
paddedData = new double[n];
for (int i = 0; i < windowedData.Count; i++) paddedData[i] = windowedData[i];
5.3 性能优化问题:FFT 对大数据量(>10万点)可能耗时。优化:
- 下采样:在 FFT 前减少数据点数(参考上一回答)。
- 并行处理:对多通道并行执行 FFT。
代码示例(下采样结合 FFT):csharp
List<double> DownsampleData(List<double> data, int targetPoints)
{
    if (data.Count <= targetPoints) return new List<double>(data);
    List<double> sampled = new List<double>();
    double step = (double)data.Count / targetPoints;
    for (int i = 0; i < targetPoints; i++)
    {
        sampled.Add(data[(int)(i * step)]);
    }
    return sampled;
}

// 在 SetMultiChannelViewData 中
int targetPoints = 1000;
foreach (int id in ls.Keys)
{
    if (PosIndexList.Contains(id))
    {
        var sampled = DownsampleData(ls[id], targetPoints);
        lst.Add(id, SmoothFourierLowPass(sampled, sampleRate, cutoffFrequency));
    }
}
times = DownsampleData(times, targetPoints);
5.4 频域可视化问题:仅平滑可能不足以满足分析需求,用户可能需要查看频率谱。优化:
- 添加频域图表,显示幅度谱。
- 允许用户交互选择截止频率。
代码示例(添加频域图表):csharp
void DisplayAmplitudeSpectrum(Oscilloscope oscilloscope, List<double> data, double sampleRate)
{
    var (frequencies, amplitudes) = GetAmplitudeSpectrum(data, sampleRate);
    var spectrumChannel = oscilloscope.AddChannel("Frequency Spectrum");
    spectrumChannel.Add(frequencies.ToList(), amplitudes.ToList());
    spectrumChannel.SetXAxisLimit(frequencies.Last(), 0, 0);
    spectrumChannel.SetYAxisLimit(amplitudes.Max() * 1.2, 0, 0);
    spectrumChannel.XLabel = "Frequency [Hz]";
    spectrumChannel.YLabel = "Amplitude";
}
6. 测试与调优为确保傅里叶变换效果,建议以下测试:
- 参数测试:
- 截止频率:测试 10Hz、50Hz、100Hz,观察平滑效果。
- 采样频率:验证 times 间隔均匀性,处理不均匀情况。
- 平滑效果:
- 比较原始数据和滤波后数据的图表,确保噪声减少且趋势保留。
- 检查峰值是否保留(如漏电流的突变)。
- 性能测试:
- 测试大数据量(>10万点)和多通道(>10个)场景,目标滤波时间 <100ms。
- 频域分析:
- 绘制幅度谱,检查主要频率成分(如 50Hz 电源干扰)。
7. 总结
- 优势:傅里叶变换通过滤除高频噪声生成平滑曲线,适合漏电流数据的示波器显示;频域分析可识别周期性特征。
- 实现:
- 使用 MathNet.Numerics 实现低通滤波,集成到 SetMultiChannelViewData。
- 可选添加频域图表。
- 优化:
- 调优采样频率和截止频率。
- 使用窗口函数和下采样减少伪影和计算量。
- 并行处理多通道数据。
- 参数建议:
- 截止频率:10-100Hz(根据数据特性)。
- 数据点数:下采样至 1000-10000 点。
通过傅里叶变换,你的示波器图表将显示更平滑的曲线,同时支持频域分析,提升数据分析能力。如果需要更详细的配置、频率选择或可视化实现,请提供更多细节!

腾讯云面向开发者汇聚海量精品云计算使用和开发经验,营造开放的云计算技术生态圈。
更多推荐
 20
20 0
0- 0


 已为社区贡献78条内容

所有评论(0)