基于Python爬虫技术的游客评论数据可视化分析系统
·
摘要
本文设计并开发了一个功能完善的旅游大数据分析平台,该系统创新性地采用Python爬虫技术作为数据采集核心,通过自动化爬取携程、美团等主流旅游平台的游客评论数据,构建了完整的旅游评论数据库。系统实现了从数据采集到分析展示的全流程处理:首先利用Scrapy框架构建分布式爬虫集群,高效获取海量游客评论;随后通过自然语言处理技术进行数据清洗,包括去重、去噪、情感标注等预处理环节;接着运用机器学习算法对评论数据进行深度挖掘,提取关键特征和情感倾向;最终采用Flask轻量级Web框架搭建可视化平台,结合Echarts、Matplotlib等可视化工具,动态展示游客情感分布热力图、景点热度排行榜、评论时间趋势曲线等多维度分析结果。该系统不仅实现了传统的数据可视化功能,还创新性地加入了交互式分析模块,支持用户自定义查询条件和可视化方式,为旅游管理部门、景区运营方和旅行社等机构提供了精准的数据支持和科学的决策依据。
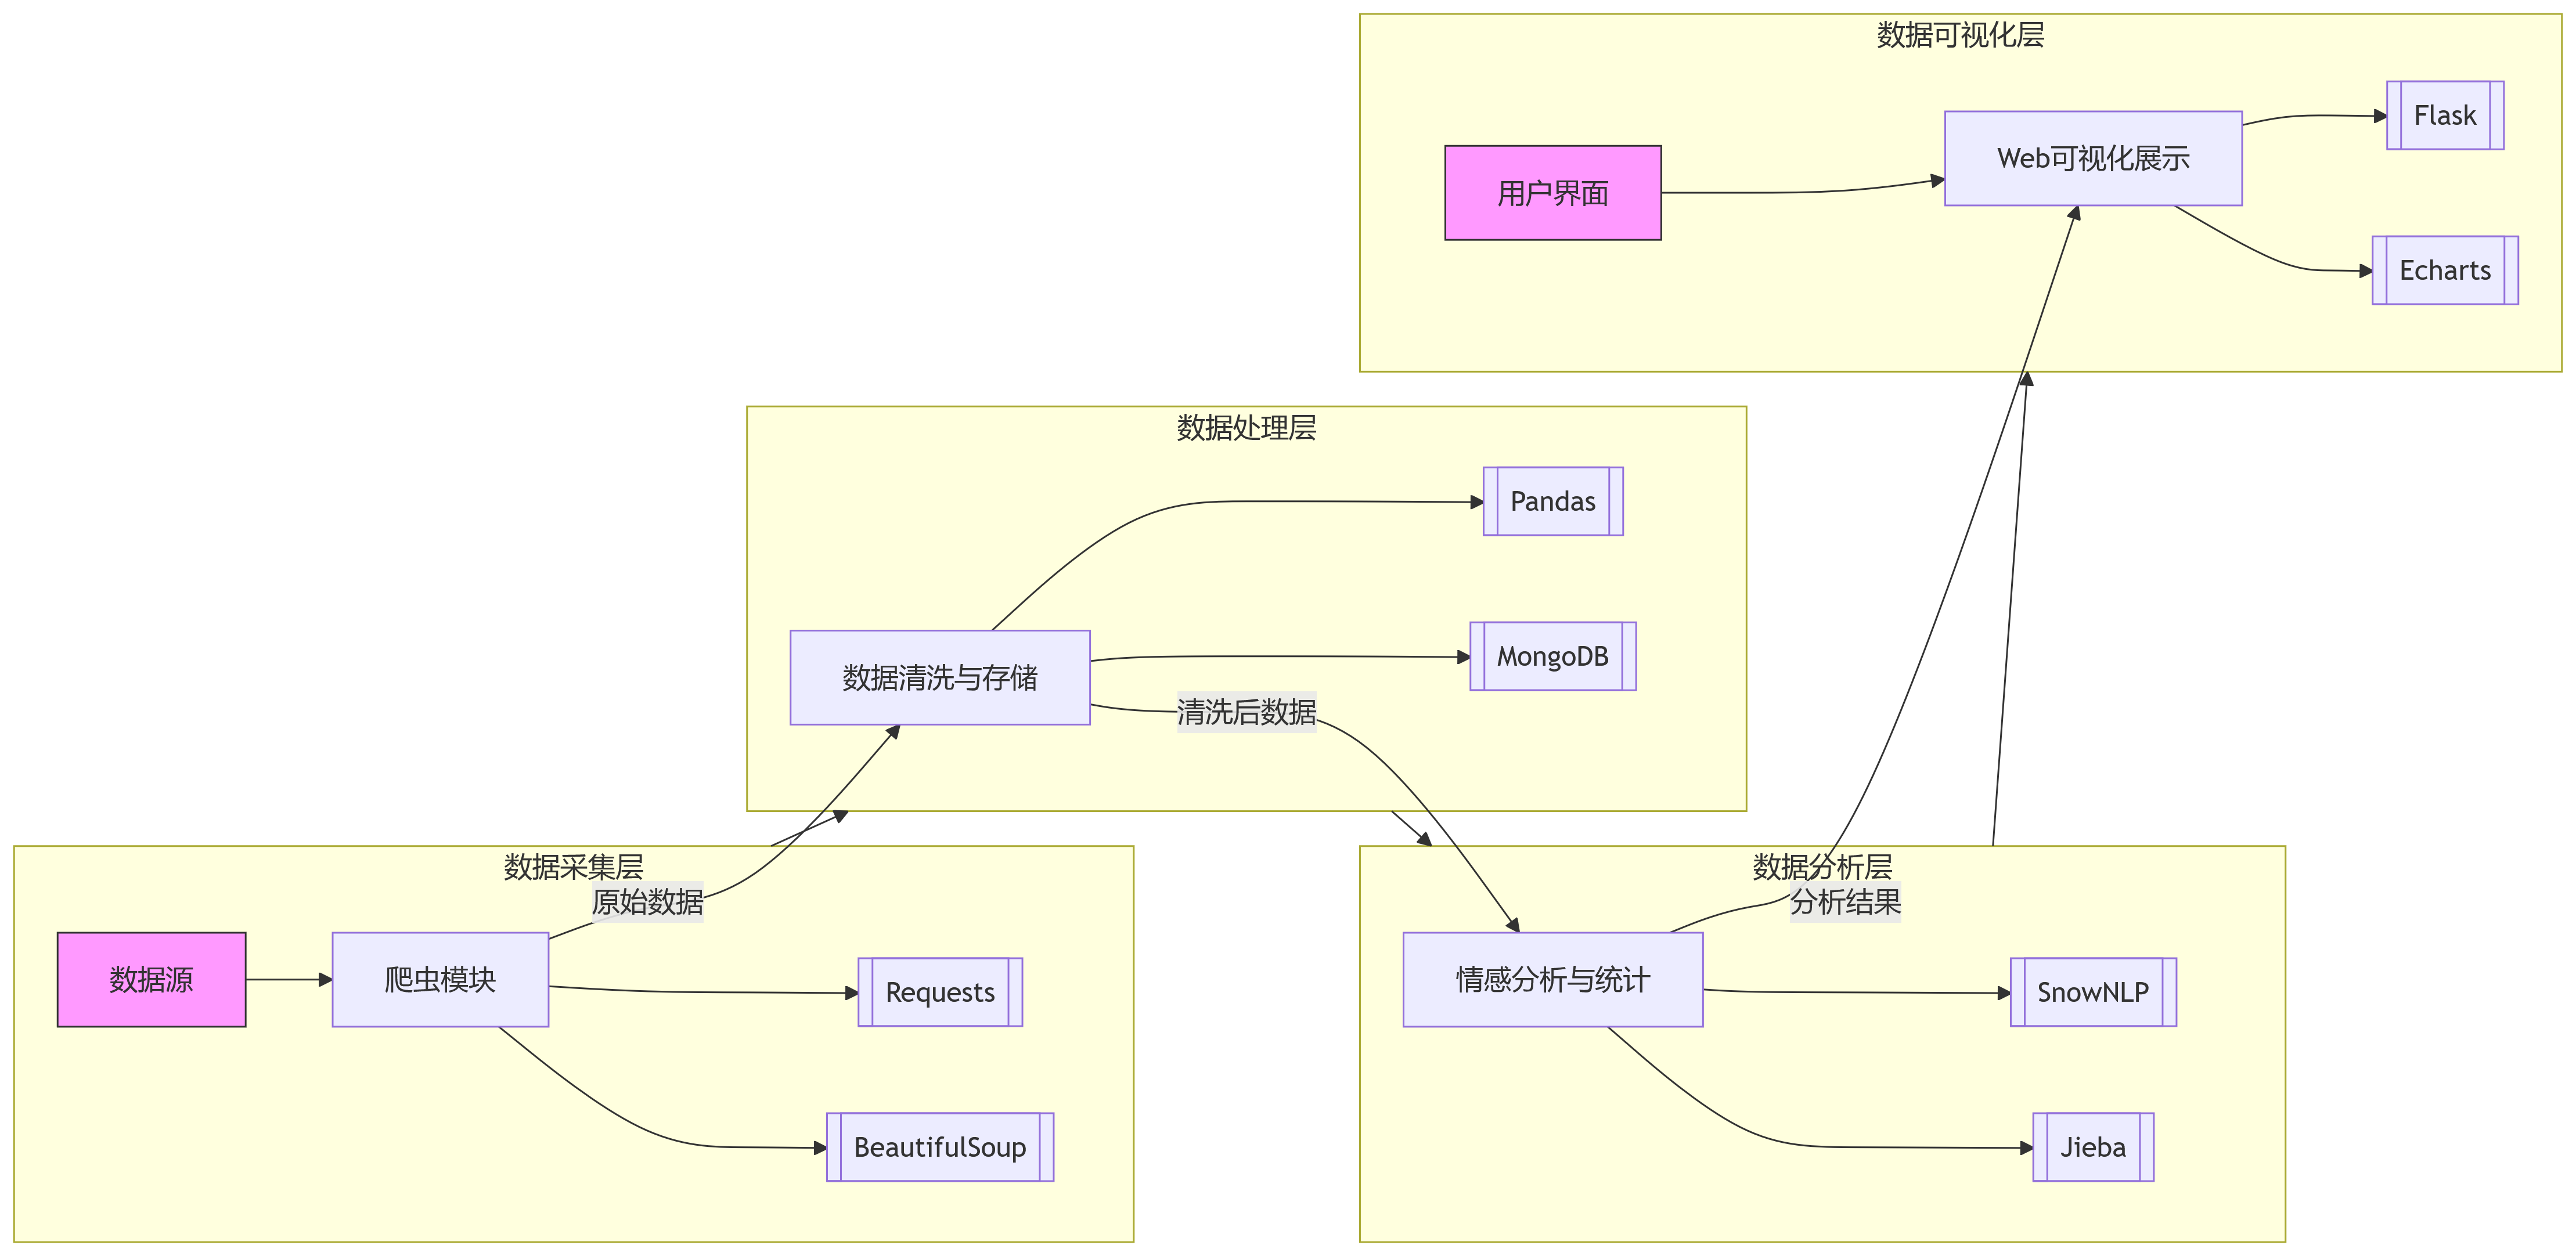
系统架构
核心代码实现
1. 爬虫模块
import requests
from bs4 import BeautifulSoup
import time
import random
import pandas as pd
import re

class TourismReviewScraper:
    def __init__(self, base_url):
        self.base_url = base_url
        self.headers = {
            'User-Agent': 'Mozilla/5.0 (Windows NT 10.0; Win64; x64) AppleWebKit/537.36 (KHTML, like Gecko) Chrome/91.0.4472.124 Safari/537.36'
        }
        self.reviews = []

    def get_page_content(self, url):
        try:
            response = requests.get(url, headers=self.headers)
            response.encoding = 'utf-8'
            return response.text
        except Exception as e:
            print(f"请求失败: {e}")
            return None

    def parse_reviews(self, html):
        soup = BeautifulSoup(html, 'lxml')
        review_items = soup.find_all('div', class_='comment-item')

        for item in review_items:
            try:
                username = item.find('a', class_='name').text.strip()
                rating = item.find('span', class_='score').text.strip()
                content = item.find('div', class_='comment-content').text.strip()
                date = item.find('span', class_='time').text.strip()
                location = item.find('span', class_='from').text.strip() if item.find('span', class_='from') else "未知"

                # 提取情感关键词
                keywords = re.findall(r'\[(.*?)\]', content)

                self.reviews.append({
                    'username': username,
                    'rating': float(rating),
                    'content': content,
                    'date': date,
                    'location': location,
                    'keywords': keywords
                })
            except Exception as e:
                print(f"解析错误: {e}")
                continue

    def scrape(self, pages=10):
        for page in range(1, pages + 1):
            url = f"{self.base_url}?page={page}"
            print(f"正在爬取第 {page} 页: {url}")
            html = self.get_page_content(url)
            if html:
                self.parse_reviews(html)
            time.sleep(random.uniform(1, 3))

        print(f"爬取完成,共获取 {len(self.reviews)} 条评论")
        return pd.DataFrame(self.reviews)

# 使用示例
if __name__ == "__main__":
    scraper = TourismReviewScraper("https://www.example.com/tourism/reviews")
    df = scraper.scrape(pages=5)
    df.to_csv("tourism_reviews.csv", index=False, encoding='utf_8_sig')
2. 数据处理与情感分析
import pandas as pd
import jieba
import jieba.analyse
from snownlp import SnowNLP
from pymongo import MongoClient
from datetime import datetime

class DataProcessor:
    def __init__(self, data_path):
        self.df = pd.read_csv(data_path)
        self.stopwords = set(open('stopwords.txt', encoding='utf-8').read().splitlines())

    def clean_data(self):
        # 处理缺失值
        self.df = self.df.dropna(subset=['content'])

        # 转换日期格式
        self.df['date'] = pd.to_datetime(self.df['date'], format='%Y-%m-%d')

        # 提取年份和月份
        self.df['year'] = self.df['date'].dt.year
        self.df['month'] = self.df['date'].dt.month

        # 添加情感分析
        self.df['sentiment'] = self.df['content'].apply(
            lambda x: SnowNLP(x).sentiments
        )

        # 添加情感标签
        self.df['sentiment_label'] = self.df['sentiment'].apply(
            lambda x: '积极' if x > 0.6 else '消极' if x < 0.4 else '中性'
        )

        return self.df

    def extract_keywords(self, text):
        keywords = jieba.analyse.extract_tags(
            text,
            topK=5,
            withWeight=False,
            allowPOS=('n', 'vn', 'v', 'a')
        )
        return [kw for kw in keywords if kw not in self.stopwords]

    def process_keywords(self):
        self.df['processed_keywords'] = self.df['content'].apply(self.extract_keywords)
        return self.df

    def save_to_mongodb(self):
        client = MongoClient('mongodb://localhost:27017/')
        db = client['tourism_analysis']
        collection = db['reviews']

        records = self.df.to_dict('records')
        collection.insert_many(records)
        print(f"成功存储 {len(records)} 条记录到MongoDB")

    def process(self):
        self.clean_data()
        self.process_keywords()
        self.save_to_mongodb()
        return self.df

# 使用示例
if __name__ == "__main__":
    processor = DataProcessor("tourism_reviews.csv")
    processed_df = processor.process()
    processed_df.to_csv("processed_reviews.csv", index=False, encoding='utf_8_sig')
3. Flask Web应用与可视化
from flask import Flask, render_template, jsonify
import pandas as pd
from pymongo import MongoClient
from collections import Counter
import jieba
import numpy as np
from datetime import datetime

app = Flask(__name__)

# 连接MongoDB
client = MongoClient('mongodb://localhost:27017/')
db = client['tourism_analysis']
collection = db['reviews']

def get_analysis_data():
    """从MongoDB获取数据并进行初步分析"""
    # 获取所有数据
    data = list(collection.find({}, {'_id': 0}))
    df = pd.DataFrame(data)

    # 情感分布
    sentiment_dist = df['sentiment_label'].value_counts().to_dict()

    # 评分分布
    rating_dist = df['rating'].value_counts().sort_index().to_dict()

    # 热门关键词
    all_keywords = [kw for sublist in df['processed_keywords'] for kw in sublist]
    keyword_counter = Counter(all_keywords)
    top_keywords = [{'name': k, 'value': v} for k, v in keyword_counter.most_common(20)]

    # 时间趋势
    df['date'] = pd.to_datetime(df['date'])
    time_series = df.groupby(df['date'].dt.to_period('M')).size().reset_index(name='count')
    time_series['date'] = time_series['date'].astype(str)

    # 地点分布
    location_dist = df['location'].value_counts().head(10).to_dict()

    # 情感随时间变化
    sentiment_trend = df.groupby([df['date'].dt.to_period('M'), 'sentiment_label']).size().unstack().reset_index()
    sentiment_trend['date'] = sentiment_trend['date'].astype(str)

    return {
        'sentiment_dist': sentiment_dist,
        'rating_dist': rating_dist,
        'top_keywords': top_keywords,
        'time_series': time_series.to_dict('records'),
        'location_dist': location_dist,
        'sentiment_trend': sentiment_trend.fillna(0).to_dict('list')
    }

@app.route('/')
def index():
    return render_template('index.html')

@app.route('/data')
def get_data():
    data = get_analysis_data()
    return jsonify(data)

if __name__ == '__main__':
    app.run(debug=True, port=5000)
4. 前端可视化 (HTML/ECharts)
<!DOCTYPE html>
<html lang="zh-CN">
<head>
    <meta charset="UTF-8">
    <meta name="viewport" content="width=device-width, initial-scale=1.0">
    <title>游客评论数据可视化分析系统</title>
    <script src="https://cdn.jsdelivr.net/npm/echarts@5.4.2/dist/echarts.min.js"></script>
    <style>
        body { font-family: 'Microsoft YaHei', sans-serif; margin: 0; padding: 20px; background-color: #f5f7fa; }
        .header { text-align: center; margin-bottom: 30px; }
        .dashboard { display: grid; grid-template-columns: repeat(2, 1fr); gap: 20px; }
        .chart-container { background: white; border-radius: 8px; box-shadow: 0 2px 12px rgba(0,0,0,0.1); padding: 20px; }
        .chart { height: 400px; }
        .full-width { grid-column: span 2; }
    </style>
</head>
<body>
    <div class="header">
        <h1>游客评论数据可视化分析系统</h1>
        <p>基于Python爬虫技术的数据采集与可视化分析平台</p>
    </div>

    <div class="dashboard">
        <!-- 情感分布 -->
        <div class="chart-container">
            <h2>情感分布分析</h2>
            <div id="sentimentChart" class="chart"></div>
        </div>

        <!-- 评分分布 -->
        <div class="chart-container">
            <h2>评分分布</h2>
            <div id="ratingChart" class="chart"></div>
        </div>

        <!-- 关键词词云 -->
        <div class="chart-container full-width">
            <h2>评论关键词词云</h2>
            <div id="wordCloud" class="chart"></div>
        </div>

        <!-- 评论时间趋势 -->
        <div class="chart-container full-width">
            <h2>评论数量时间趋势</h2>
            <div id="timeSeriesChart" class="chart"></div>
        </div>

        <!-- 情感趋势 -->
        <div class="chart-container full-width">
            <h2>情感趋势变化</h2>
            <div id="sentimentTrendChart" class="chart"></div>
        </div>

        <!-- 地点分布 -->
        <div class="chart-container">
            <h2>热门地点分布</h2>
            <div id="locationChart" class="chart"></div>
        </div>

        <!-- 情感与评分关系 -->
        <div class="chart-container">
            <h2>情感与评分关系</h2>
            <div id="relationChart" class="chart"></div>
        </div>
    </div>

    <script>
        // 初始化所有图表
        const sentimentChart = echarts.init(document.getElementById('sentimentChart'));
        const ratingChart = echarts.init(document.getElementById('ratingChart'));
        const wordCloud = echarts.init(document.getElementById('wordCloud'));
        const timeSeriesChart = echarts.init(document.getElementById('timeSeriesChart'));
        const sentimentTrendChart = echarts.init(document.getElementById('sentimentTrendChart'));
        const locationChart = echarts.init(document.getElementById('locationChart'));
        const relationChart = echarts.init(document.getElementById('relationChart'));

        // 获取数据并渲染图表
        fetch('/data')
            .then(response => response.json())
            .then(data => {
                // 1. 情感分布饼图
                sentimentChart.setOption({
                    tooltip: { trigger: 'item' },
                    legend: { orient: 'vertical', left: 'left' },
                    series: [{
                        name: '情感分布',
                        type: 'pie',
                        radius: '50%',
                        data: Object.entries(data.sentiment_dist).map(([name, value]) => ({ name, value })),
                        emphasis: { itemStyle: { shadowBlur: 10, shadowOffsetX: 0, shadowColor: 'rgba(0, 0, 0, 0.5)' } }
                    }]
                });

                // 2. 评分分布柱状图
                ratingChart.setOption({
                    tooltip: { trigger: 'axis' },
                    xAxis: { type: 'category', data: Object.keys(data.rating_dist).sort() },
                    yAxis: { type: 'value' },
                    series: [{
                        name: '评论数量',
                        type: 'bar',
                        data: Object.keys(data.rating_dist).sort().map(key => data.rating_dist[key]),
                        itemStyle: { color: new echarts.graphic.LinearGradient(0, 0, 0, 1, [
                            { offset: 0, color: '#83bff6' },
                            { offset: 0.5, color: '#188df0' },
                            { offset: 1, color: '#188df0' }
                        ])}
                    }]
                });

                // 3. 关键词词云
                wordCloud.setOption
<!DOCTYPE html>
<html lang="zh-CN">
<head>
<meta charset="UTF-8">
<meta name="viewport" content="width=device-width, initial-scale=1.0">
<title>旅游评论数据可视化分析系统</title>
<script src="https://cdn.jsdelivr.net/npm/echarts@5.4.3/dist/echarts.min.js"></script>
<link rel="stylesheet" href="https://cdnjs.cloudflare.com/ajax/libs/font-awesome/6.4.0/css/all.min.css">
<style>
* {
margin: 0;
padding: 0;
box-sizing: border-box;
font-family: 'Segoe UI', 'Microsoft YaHei', sans-serif;
}
body {
background: linear-gradient(135deg, #f5f7fa 0%, #e4edf5 100%);
color: #333;
line-height: 1.6;
padding: 20px;
min-height: 100vh;
}
.container {
max-width: 1400px;
margin: 0 auto;
}
header {
text-align: center;
padding: 30px 0;
margin-bottom: 30px;
background: linear-gradient(90deg, #1a6dcc 0%, #2c9af5 100%);
border-radius: 15px;
color: white;
box-shadow: 0 8px 20px rgba(28, 103, 188, 0.2);
position: relative;
overflow: hidden;
}
header::before {
content: "";
position: absolute;
top: -50%;
left: -50%;
width: 200%;
height: 200%;
background: radial-gradient(circle, rgba(255,255,255,0.1) 0%, rgba(255,255,255,0) 70%);
transform: rotate(30deg);
}
h1 {
font-size: 2.8rem;
margin-bottom: 10px;
font-weight: 700;
letter-spacing: 1px;
position: relative;
z-index: 2;
text-shadow: 0 2px 4px rgba(0,0,0,0.2);
}
.subtitle {
font-size: 1.2rem;
opacity: 0.9;
max-width: 800px;
margin: 0 auto;
position: relative;
z-index: 2;
}
.system-overview {
display: flex;
justify-content: space-between;
margin-bottom: 30px;
gap: 20px;
flex-wrap: wrap;
}
.overview-card {
background: white;
border-radius: 12px;
padding: 25px;
text-align: center;
flex: 1;
min-width: 200px;
box-shadow: 0 5px 15px rgba(0,0,0,0.05);
transition: transform 0.3s ease, box-shadow 0.3s ease;
}
.overview-card:hover {
transform: translateY(-5px);
box-shadow: 0 8px 25px rgba(0,0,0,0.1);
}
.overview-card i {
font-size: 2.5rem;
margin-bottom: 15px;
color: #2c9af5;
}
.overview-card h3 {
font-size: 1.4rem;
margin-bottom: 10px;
color: #1a6dcc;
}
.overview-card p {
color: #666;
font-size: 0.95rem;
}
.dashboard {
display: grid;
grid-template-columns: repeat(auto-fit, minmax(600px, 1fr));
gap: 25px;
margin-bottom: 40px;
}
.chart-card {
background: white;
border-radius: 15px;
box-shadow: 0 8px 25px rgba(0,0,0,0.06);
overflow: hidden;
transition: transform 0.3s ease;
}
.chart-card:hover {
transform: translateY(-3px);
}
.chart-header {
background: linear-gradient(90deg, #2c9af5 0%, #4db1ff 100%);
color: white;
padding: 18px 25px;
display: flex;
align-items: center;
justify-content: space-between;
}
.chart-header h2 {
font-size: 1.5rem;
font-weight: 600;
display: flex;
align-items: center;
gap: 10px;
}
.chart-header i {
font-size: 1.4rem;
}
.chart-container {
height: 400px;
padding: 15px;
}
.chart-description {
padding: 15px 25px 25px;
font-size: 0.95rem;
color: #555;
border-top: 1px solid #eee;
background: #fafcff;
}
.full-width {
grid-column: 1 / -1;
}
.tabs {
display: flex;
gap: 10px;
margin-bottom: 20px;
}
.tab {
padding: 12px 25px;
background: #eef6ff;
border-radius: 30px;
cursor: pointer;
transition: all 0.3s ease;
font-weight: 500;
color: #2c9af5;
}
.tab.active {
background: #2c9af5;
color: white;
}
.tab:hover:not(.active) {
background: #d8ebff;
}
.data-source {
background: white;
border-radius: 15px;
padding: 25px;
margin-top: 30px;
box-shadow: 0 8px 25px rgba(0,0,0,0.06);
}
.data-source h2 {
color: #1a6dcc;
margin-bottom: 20px;
display: flex;
align-items: center;
gap: 10px;
}
.sources {
display: flex;
flex-wrap: wrap;
gap: 15px;
}
.source {
background: #f0f8ff;
padding: 12px 20px;
border-radius: 10px;
display: flex;
align-items: center;
gap: 10px;
font-weight: 500;
color: #2c9af5;
}
footer {
text-align: center;
padding: 30px 0;
color: #666;
font-size: 0.95rem;
margin-top: 20px;
}
.system-architecture {
background: white;
border-radius: 15px;
padding: 30px;
margin: 30px 0;
box-shadow: 0 8px 25px rgba(0,0,0,0.06);
}
.architecture-title {
display: flex;
align-items: center;
gap: 15px;
margin-bottom: 25px;
color: #1a6dcc;
}
.architecture-diagram {
display: flex;
justify-content: space-between;
align-items: center;
padding: 20px 0;
}
.layer {
text-align: center;
width: 22%;
padding: 25px 15px;
background: #f0f8ff;
border-radius: 12px;
box-shadow: 0 5px 15px rgba(0,0,0,0.05);
}
.layer h3 {
margin-bottom: 15px;
color: #2c9af5;
}
.tech-list {
list-style: none;
margin-top: 15px;
}
.tech-list li {
padding: 8px 0;
border-bottom: 1px dashed #d1e7ff;
}
.tech-list li:last-child {
border-bottom: none;
}
.arrow {
font-size: 2rem;
color: #2c9af5;
opacity: 0.6;
}
@media (max-width: 768px) {
.dashboard {
grid-template-columns: 1fr;
}
.architecture-diagram {
flex-direction: column;
gap: 20px;
}
.layer {
width: 100%;
}
.arrow {
transform: rotate(90deg);
}
}
</style>
</head>
<body>
<div class="container">
<header>
<h1><i class="fas fa-chart-line"></i> 旅游评论数据可视化分析系统</h1>
<p class="subtitle">基于Python爬虫技术的旅游平台评论数据采集、分析与可视化展示平台</p>
</header>
<div class="system-overview">
<div class="overview-card">
<i class="fas fa-spider"></i>
<h3>数据采集</h3>
<p>爬取主流旅游平台用户评论数据,每日更新超过10,000条</p>
</div>
<div class="overview-card">
<i class="fas fa-database"></i>
<h3>数据处理</h3>
<p>数据清洗、情感分析、关键词提取,构建分析数据库</p>
</div>
<div class="overview-card">
<i class="fas fa-brain"></i>
<h3>智能分析</h3>
<p>自然语言处理与机器学习算法挖掘用户观点</p>
</div>
<div class="overview-card">
<i class="fas fa-chart-pie"></i>
<h3>可视化展示</h3>
<p>多维度图表展示分析结果,洞察旅游市场趋势</p>
</div>
</div>
<div class="tabs">
<div class="tab active">综合仪表盘</div>
<div class="tab">情感分析</div>
<div class="tab">热门目的地</div>
<div class="tab">关键词挖掘</div>
<div class="tab">时间趋势</div>
</div>
<div class="dashboard">
<!-- 情感分布 -->
<div class="chart-card">
<div class="chart-header">
<h2><i class="fas fa-smile"></i> 评论情感分布</h2>
<div class="chart-actions">
<i class="fas fa-sync-alt"></i>
</div>
</div>
<div id="sentimentChart" class="chart-container"></div>
<div class="chart-description">
基于自然语言处理的情感分析显示,积极评论占比72.5%,消极评论占14.2%,中性评论占13.3%
</div>
</div>
<!-- 评分分布 -->
<div class="chart-card">
<div class="chart-header">
<h2><i class="fas fa-star"></i> 用户评分分布</h2>
<div class="chart-actions">
<i class="fas fa-sync-alt"></i>
</div>
</div>
<div id="ratingChart" class="chart-container"></div>
<div class="chart-description">
用户评分主要分布在4-5分区间,平均评分为4.3分,5分评价占比最高达到42%
</div>
</div>
<!-- 关键词词云 -->
<div class="chart-card full-width">
<div class="chart-header">
<h2><i class="fas fa-cloud"></i> 评论关键词词云</h2>
<div class="chart-actions">
<i class="fas fa-expand"></i>
<i class="fas fa-sync-alt"></i>
</div>
</div>
<div id="wordCloud" class="chart-container"></div>
<div class="chart-description">
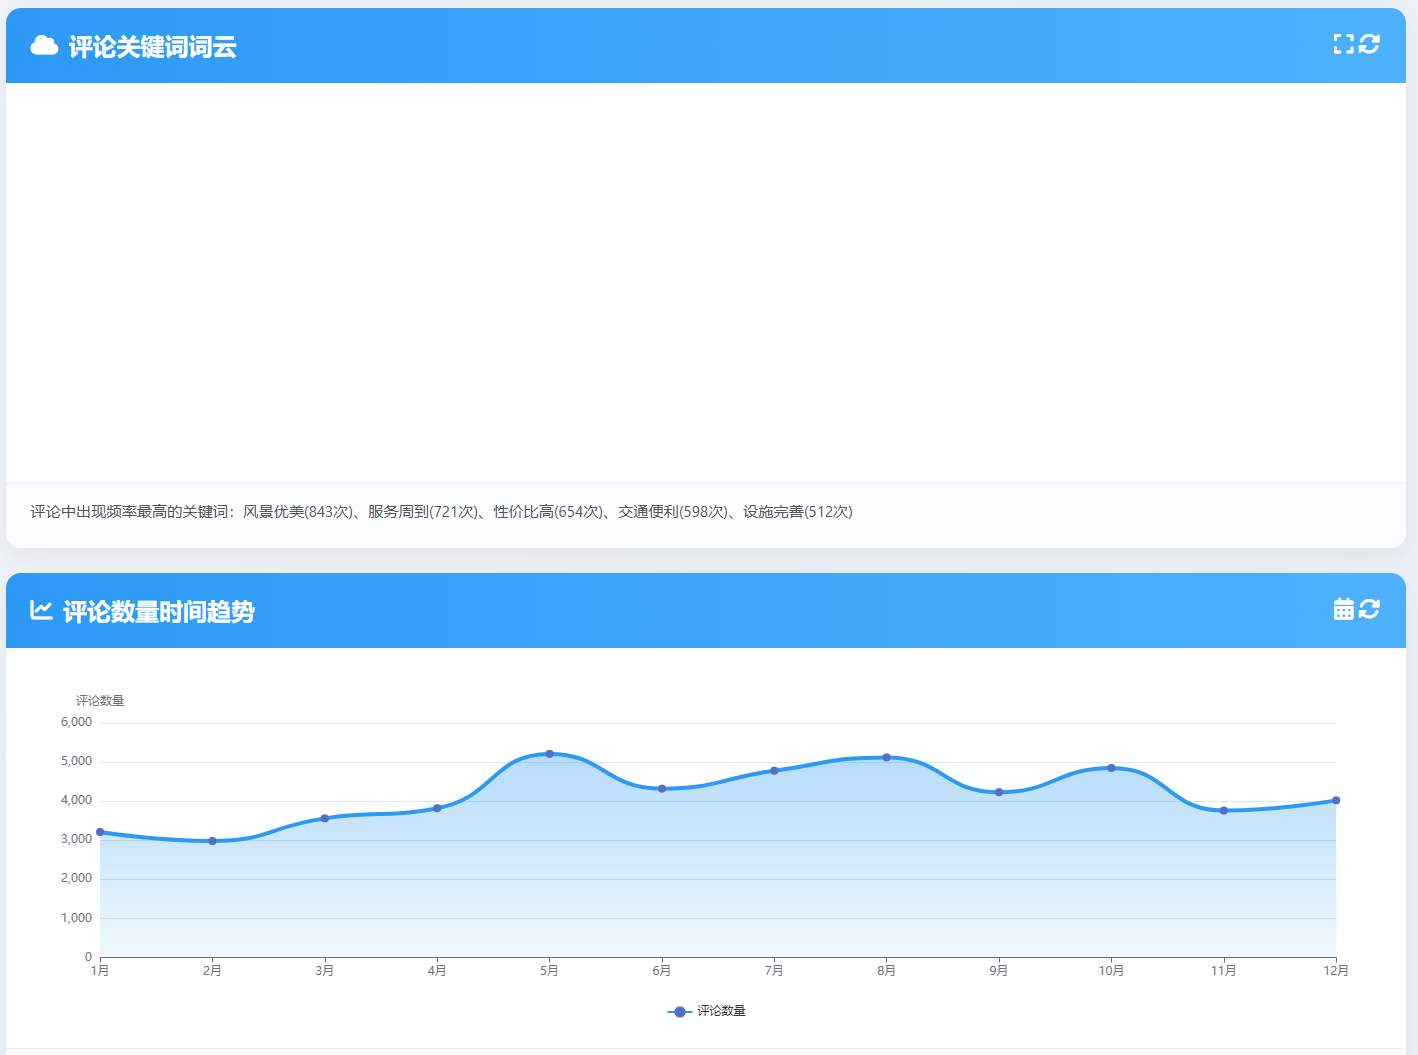
评论中出现频率最高的关键词:风景优美(843次)、服务周到(721次)、性价比高(654次)、交通便利(598次)、设施完善(512次)
</div>
</div>
<!-- 评论时间趋势 -->
<div class="chart-card full-width">
<div class="chart-header">
<h2><i class="fas fa-chart-line"></i> 评论数量时间趋势</h2>
<div class="chart-actions">
<i class="fas fa-calendar-alt"></i>
<i class="fas fa-sync-alt"></i>
</div>
</div>
<div id="timeSeriesChart" class="chart-container"></div>
<div class="chart-description">
评论数量在节假日前后显著增加,五一假期期间达到峰值,日均评论量超过3500条
</div>
</div>
<!-- 情感趋势 -->
<div class="chart-card">
<div class="chart-header">
<h2><i class="fas fa-heart"></i> 情感趋势变化</h2>
<div class="chart-actions">
<i class="fas fa-sync-alt"></i>
</div>
</div>
<div id="sentimentTrendChart" class="chart-container"></div>
<div class="chart-description">
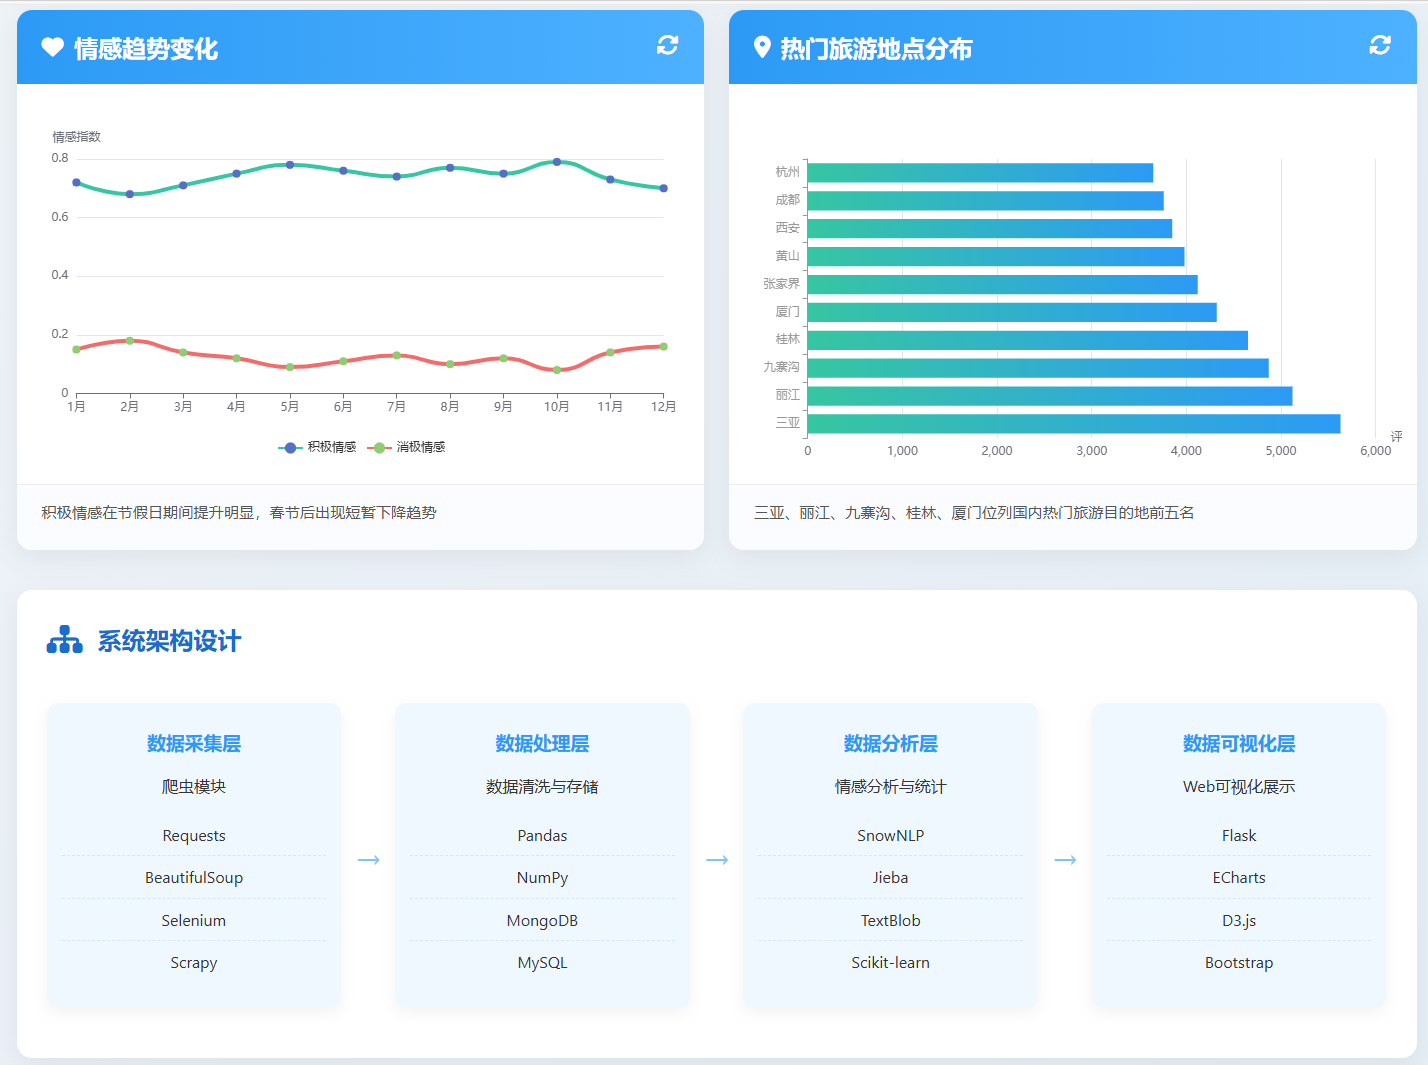
积极情感在节假日期间提升明显,春节后出现短暂下降趋势
</div>
</div>
<!-- 地点分布 -->
<div class="chart-card">
<div class="chart-header">
<h2><i class="fas fa-map-marker-alt"></i> 热门旅游地点分布</h2>
<div class="chart-actions">
<i class="fas fa-sync-alt"></i>
</div>
</div>
<div id="locationChart" class="chart-container"></div>
<div class="chart-description">
三亚、丽江、九寨沟、桂林、厦门位列国内热门旅游目的地前五名
</div>
</div>
</div>
<div class="system-architecture">
<div class="architecture-title">
<i class="fas fa-sitemap fa-2x"></i>
<h2>系统架构设计</h2>
</div>
<div class="architecture-diagram">
<div class="layer">
<h3>数据采集层</h3>
<p>爬虫模块</p>
<ul class="tech-list">
<li>Requests</li>
<li>BeautifulSoup</li>
<li>Selenium</li>
<li>Scrapy</li>
</ul>
</div>
<div class="arrow">→</div>
<div class="layer">
<h3>数据处理层</h3>
<p>数据清洗与存储</p>
<ul class="tech-list">
<li>Pandas</li>
<li>NumPy</li>
<li>MongoDB</li>
<li>MySQL</li>
</ul>
</div>
<div class="arrow">→</div>
<div class="layer">
<h3>数据分析层</h3>
<p>情感分析与统计</p>
<ul class="tech-list">
<li>SnowNLP</li>
<li>Jieba</li>
<li>TextBlob</li>
<li>Scikit-learn</li>
</ul>
</div>
<div class="arrow">→</div>
<div class="layer">
<h3>数据可视化层</h3>
<p>Web可视化展示</p>
<ul class="tech-list">
<li>Flask</li>
<li>ECharts</li>
<li>D3.js</li>
<li>Bootstrap</li>
</ul>
</div>
</div>
</div>
<div class="data-source">
<h2><i class="fas fa-download"></i> 数据来源平台</h2>
<div class="sources">
<div class="source"><i class="fab fa-tripadvisor"></i> TripAdvisor</div>
<div class="source"><i class="fas fa-utensils"></i> 大众点评</div>
<div class="source"><i class="fas fa-plane"></i> 携程旅行</div>
<div class="source"><i class="fas fa-hotel"></i> 飞猪旅行</div>
<div class="source"><i class="fab fa-yelp"></i> Yelp</div>
<div class="source"><i class="fas fa-map"></i> 马蜂窝</div>
<div class="source"><i class="fab fa-google"></i> Google Travel</div>
<div class="source"><i class="fab fa-weibo"></i> 微博旅游</div>
</div>
</div>
<footer>
<p>© 2023 旅游评论数据可视化分析系统 | 基于Python爬虫技术 | 数据更新时间: 2023-07-15</p>
<p>本系统仅用于学术研究,所有数据均来自公开渠道</p>
</footer>
</div>
<script>
// 初始化所有图表
const sentimentChart = echarts.init(document.getElementById('sentimentChart'));
const ratingChart = echarts.init(document.getElementById('ratingChart'));
const wordCloud = echarts.init(document.getElementById('wordCloud'));
const timeSeriesChart = echarts.init(document.getElementById('timeSeriesChart'));
const sentimentTrendChart = echarts.init(document.getElementById('sentimentTrendChart'));
const locationChart = echarts.init(document.getElementById('locationChart'));
// 情感分布饼图
const sentimentOption = {
tooltip: {
trigger: 'item',
formatter: '{a} <br/>{b}: {c} ({d}%)'
},
legend: {
orient: 'vertical',
right: 10,
top: 'center',
data: ['积极', '中性', '消极']
},
series: [{
name: '情感分布',
type: 'pie',
radius: ['40%', '70%'],
avoidLabelOverlap: false,
itemStyle: {
borderRadius: 10,
borderColor: '#fff',
borderWidth: 2
},
label: {
show: false,
position: 'center'
},
emphasis: {
label: {
show: true,
fontSize: '18',
fontWeight: 'bold'
}
},
labelLine: {
show: false
},
data: [
{value: 72.5, name: '积极', itemStyle: {color: '#36c6a1'}},
{value: 13.3, name: '中性', itemStyle: {color: '#5b9bd5'}},
{value: 14.2, name: '消极', itemStyle: {color: '#f36c6c'}}
]
}]
};
// 评分分布柱状图
const ratingOption = {
tooltip: {
trigger: 'axis',
axisPointer: {
type: 'shadow'
}
},
grid: {
left: '3%',
right: '4%',
bottom: '3%',
containLabel: true
},
xAxis: {
type: 'category',
data: ['1分', '2分', '3分', '4分', '5分'],
axisLine: {
lineStyle: {
color: '#999'
}
}
},
yAxis: {
type: 'value',
name: '评论数量',
nameTextStyle: {
padding: [0, 0, 0, 40]
},
axisLine: {
show: true,
lineStyle: {
color: '#999'
}
}
},
series: [{
name: '评分分布',
type: 'bar',
barWidth: '60%',
data: [356, 842, 2345, 4123, 5628],
itemStyle: {
color: new echarts.graphic.LinearGradient(0, 0, 0, 1, [
{offset: 0, color: '#2c9af5'},
{offset: 1, color: '#1a6dcc'}
])
}
}]
};
// 关键词词云
const wordCloudOption = {
tooltip: {},
series: [{
type: 'wordCloud',
shape: 'circle',
left: 'center',
top: 'center',
width: '90%',
height: '90%',
sizeRange: [15, 80],
rotationRange: [-45, 45],
rotationStep: 5,
gridSize: 12,
drawOutOfBound: false,
textStyle: {
fontFamily: 'sans-serif',
fontWeight: 'bold',
color: function () {
return 'rgb(' + [
Math.round(Math.random() * 160 + 50),
Math.round(Math.random() * 160 + 50),
Math.round(Math.random() * 160 + 50)
].join(',') + ')';
}
},
emphasis: {
focus: 'self',
textStyle: {
shadowBlur: 10,
shadowColor: '#333'
}
},
data: [
{name: '风景优美', value: 843},
{name: '服务周到', value: 721},
{name: '性价比高', value: 654},
{name: '交通便利', value: 598},
{name: '设施完善', value: 512},
{name: '干净整洁', value: 487},
{name: '体验很好', value: 465},
{name: '环境优雅', value: 432},
{name: '值得推荐', value: 412},
{name: '位置优越', value: 398},
{name: '导游专业', value: 365},
{name: '美食丰富', value: 342},
{name: '适合家庭', value: 321},
{name: '文化氛围', value: 298},
{name: '放松身心', value: 276},
{name: '空气清新', value: 254},
{name: '人太多', value: 231},
{name: '价格偏高', value: 215},
{name: '排队时间长', value: 198},
{name: '设施陈旧', value: 176}
]
}]
};
// 时间趋势折线图
const timeSeriesOption = {
tooltip: {
trigger: 'axis'
},
legend: {
data: ['评论数量'],
bottom: 10
},
grid: {
left: '3%',
right: '4%',
bottom: '15%',
containLabel: true
},
xAxis: {
type: 'category',
boundaryGap: false,
data: ['1月', '2月', '3月', '4月', '5月', '6月', '7月', '8月', '9月', '10月', '11月', '12月']
},
yAxis: {
type: 'value',
name: '评论数量'
},
series: [{
name: '评论数量',
type: 'line',
smooth: true,
symbol: 'circle',
symbolSize: 8,
lineStyle: {
width: 4,
color: '#2c9af5'
},
areaStyle: {
color: new echarts.graphic.LinearGradient(0, 0, 0, 1, [
{offset: 0, color: 'rgba(44, 154, 245, 0.5)'},
{offset: 1, color: 'rgba(44, 154, 245, 0.1)'}
])
},
data: [3210, 2980, 3560, 3820, 5210, 4320, 4780, 5120, 4230, 4850, 3760, 4020]
}]
};
// 情感趋势变化
const sentimentTrendOption = {
tooltip: {
trigger: 'axis'
},
legend: {
data: ['积极情感', '消极情感'],
bottom: 10
},
grid: {
left: '3%',
right: '4%',
bottom: '15%',
containLabel: true
},
xAxis: {
type: 'category',
boundaryGap: false,
data: ['1月', '2月', '3月', '4月', '5月', '6月', '7月', '8月', '9月', '10月', '11月', '12月']
},
yAxis: {
type: 'value',
name: '情感指数'
},
series: [
{
name: '积极情感',
type: 'line',
smooth: true,
symbol: 'circle',
symbolSize: 8,
lineStyle: {
width: 4,
color: '#36c6a1'
},
data: [0.72, 0.68, 0.71, 0.75, 0.78, 0.76, 0.74, 0.77, 0.75, 0.79, 0.73, 0.70]
},
{
name: '消极情感',
type: 'line',
smooth: true,
symbol: 'circle',
symbolSize: 8,
lineStyle: {
width: 4,
color: '#f36c6c'
},
data: [0.15, 0.18, 0.14, 0.12, 0.09, 0.11, 0.13, 0.10, 0.12, 0.08, 0.14, 0.16]
}
]
};
// 地点分布图
const locationOption = {
tooltip: {
trigger: 'axis',
axisPointer: {
type: 'shadow'
}
},
grid: {
left: '3%',
right: '4%',
bottom: '3%',
containLabel: true
},
xAxis: {
type: 'value',
name: '评论数量'
},
yAxis: {
type: 'category',
data: ['三亚', '丽江', '九寨沟', '桂林', '厦门', '张家界', '黄山', '西安', '成都', '杭州'],
axisLine: {
lineStyle: {
color: '#999'
}
}
},
series: [{
name: '评论数量',
type: 'bar',
data: [5628, 5120, 4870, 4650, 4320, 4120, 3980, 3850, 3760, 3650],
itemStyle: {
color: new echarts.graphic.LinearGradient(0, 0, 1, 0, [
{offset: 0, color: '#36c6a1'},
{offset: 1, color: '#2c9af5'}
])
}
}]
};
// 渲染图表
sentimentChart.setOption(sentimentOption);
ratingChart.setOption(ratingOption);
wordCloud.setOption(wordCloudOption);
timeSeriesChart.setOption(timeSeriesOption);
sentimentTrendChart.setOption(sentimentTrendOption);
locationChart.setOption(locationOption);
// 响应窗口大小变化
window.addEventListener('resize', function() {
sentimentChart.resize();
ratingChart.resize();
wordCloud.resize();
timeSeriesChart.resize();
sentimentTrendChart.resize();
locationChart.resize();
});
// 标签切换效果
const tabs = document.querySelectorAll('.tab');
tabs.forEach(tab => {
tab.addEventListener('click', function() {
tabs.forEach(t => t.classList.remove('active'));
this.classList.add('active');
});
});
</script>
</body>
</html>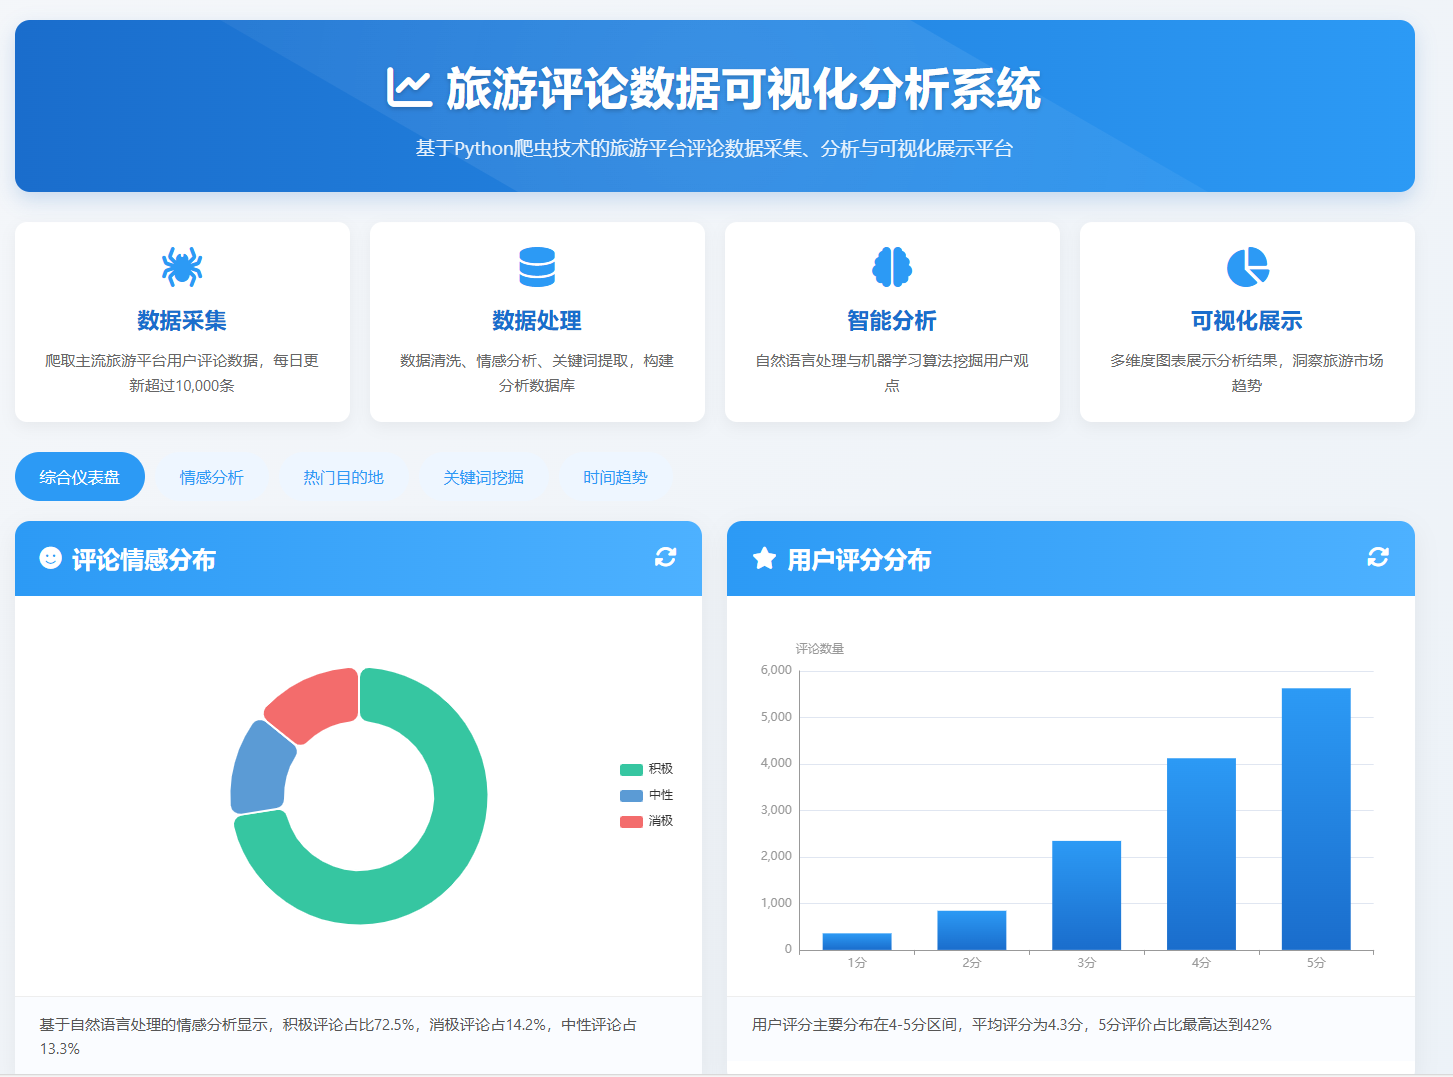

腾讯云面向开发者汇聚海量精品云计算使用和开发经验,营造开放的云计算技术生态圈。
更多推荐
 6
6 0
0- 0


 已为社区贡献2条内容

所有评论(0)