第七章 Leaflet 地理数据可视化:基于高德地图展示 GeoJSON 数据展示与样式定制
·
效果图
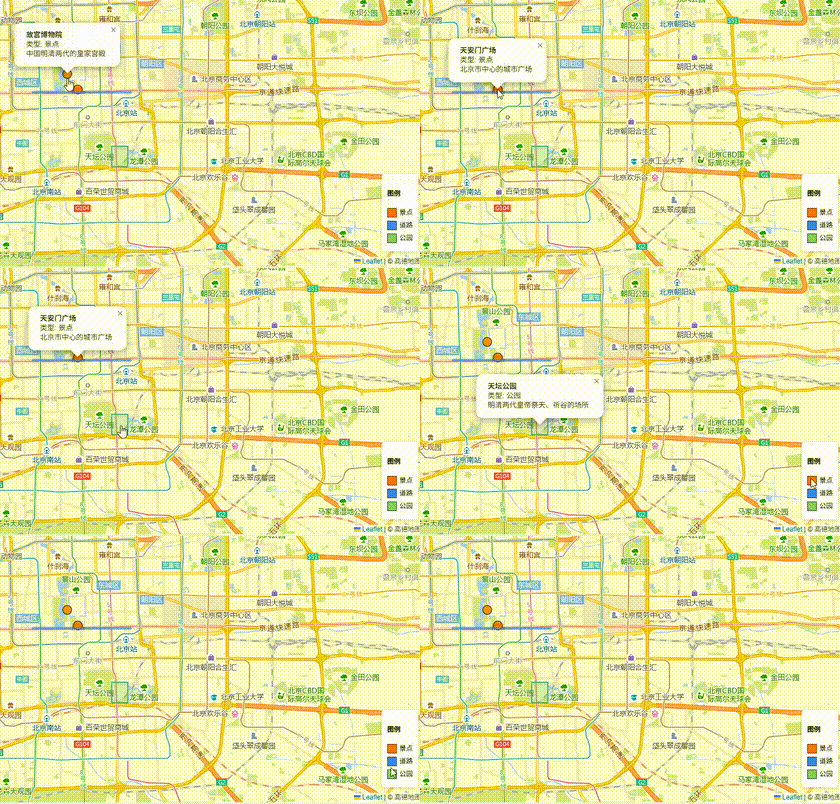
GeoJSON 作为一种轻量级的地理数据交换格式,被广泛用于存储和展示地理要素。本文将介绍如何在 Leaflet 中结合高德地图,加载并可视化 GeoJSON 数据,实现点、线、面等地理要素的个性化展示。
完整代码在末尾
一、技术栈与应用场景
技术选型优势
- Leaflet:轻量级开源地图库,提供完善的 GeoJSON 解析与渲染能力
- 高德地图:国内地图数据精准,瓦片加载速度快,与 GeoJSON 数据结合展示效果佳
- GeoJSON:结构简单、易于理解,支持点、线、面等多种地理要素,便于前后端数据交互
典型应用场景
- 城市 POI(兴趣点)展示
- 交通路线可视化
- 区域划分与边界展示
- 地理数据统计与分析
二、开发环境准备
只需引入 Leaflet 核心库即可开始开发,无需额外依赖:
<!-- Leaflet样式文件 -->
<link rel="stylesheet" href="https://unpkg.com/leaflet@1.9.4/dist/leaflet.css"
      integrity="sha256-p4NxAoJBhIIN+hmNHrzRCf9tD/miZyoHS5obTRR9BMY="
      crossorigin=""/>
<!-- Leaflet核心脚本 -->
<script src="https://unpkg.com/leaflet@1.9.4/dist/leaflet.js"
        integrity="sha256-20nQCchB9co0qIjJZRGuk2/Z9VM+kNiyxNV1lvTlZBo="
        crossorigin=""></script>
三、实现步骤详解
1. 地图容器与基础样式
首先创建地图容器并设置基础样式:
<div class="container">
    <h1>Leaflet+高德地图:GeoJSON数据可视化</h1>
    <div id="map"></div>
    <p>示例展示了GeoJSON格式的点、线、面地理要素在高德地图上的可视化效果</p>
</div>

<style>
    #map {
        width: 100%;
        height: 600px;
    }
    .container {
        max-width: 1200px;
        margin: 20px auto;
        padding: 0 20px;
    }
    .legend {
        background: white;
        padding: 10px;
        border-radius: 5px;
        box-shadow: 0 1px 5px rgba(0,0,0,0.2);
    }
    .legend-item {
        margin-bottom: 5px;
        display: flex;
        align-items: center;
    }
    .color-box {
        width: 15px;
        height: 15px;
        margin-right: 5px;
        border: 1px solid #333;
    }
</style>
2. 初始化高德地图图层
使用高德标准地图作为底图,为后续 GeoJSON 数据展示提供基础:
// 初始化地图,中心点设为北京
const map = L.map('map').setView([39.9042, 116.4074], 12);

// 添加高德标准地图图层
L.tileLayer('https://webrd0{s}.is.autonavi.com/appmaptile?lang=zh_cn&size=1&scale=1&style=8&x={x}&y={y}&z={z}', {
    subdomains: ['1', '2', '3', '4'],
    attribution: '© 高德地图'
}).addTo(map);
3. 准备 GeoJSON 数据
定义包含点、线、面三种地理要素的 GeoJSON 数据,模拟北京市内的景点、道路和公园:
const beijingLandmarks = {
    "type": "FeatureCollection",
    "features": [
        // 点特征 - 著名景点
        {
            "type": "Feature",
            "properties": {
                "name": "天安门广场",
                "type": "景点",
                "description": "北京市中心的城市广场"
            },
            "geometry": {
                "type": "Point",
                "coordinates": [116.397470, 39.908823]  // GeoJSON坐标是[经度, 纬度]
            }
        },
        {
            "type": "Feature",
            "properties": {
                "name": "故宫博物院",
                "type": "景点",
                "description": "中国明清两代的皇家宫殿"
            },
            "geometry": {
                "type": "Point",
                "coordinates": [116.390812, 39.916365]
            }
        },
        // 线特征 - 主要道路
        {
            "type": "Feature",
            "properties": {
                "name": "长安街",
                "type": "道路",
                "description": "北京市中心的东西向主要街道"
            },
            "geometry": {
                "type": "LineString",
                "coordinates": [
                    [116.3700, 39.9075],
                    [116.3850, 39.9075],
                    [116.4000, 39.9075],
                    [116.4150, 39.9075],
                    [116.4300, 39.9075]
                ]
            }
        },
        // 面特征 - 公园区域
        {
            "type": "Feature",
            "properties": {
                "name": "天坛公园",
                "type": "公园",
                "description": "明清两代皇帝祭天、祈谷的场所"
            },
            "geometry": {
                "type": "Polygon",
                "coordinates": [
                    [
                        [116.4183, 39.8822],
                        [116.4283, 39.8822],
                        [116.4283, 39.8722],
                        [116.4183, 39.8722],
                        [116.4183, 39.8822]
                    ]
                ]
            }
        }
    ]
};
注意:GeoJSON 坐标格式是[经度, 纬度],与 Leaflet 常用的[纬度, 经度]顺序相反,使用时需特别注意。
4. 自定义 GeoJSON 样式
根据地理要素类型(景点、道路、公园)设置不同的展示样式,提高可视化效果:
// 定义样式函数 - 根据特征类型设置不同样式
function styleFeature(feature) {
    switch (feature.properties.type) {
        case "景点":
            return {
                radius: 8,
                fillColor: "#ff7800",
                color: "#000",
                weight: 1,
                opacity: 1,
                fillOpacity: 0.8
            };
        case "道路":
            return {
                color: "#3388ff",
                weight: 5,
                opacity: 0.7
            };
        case "公园":
            return {
                color: "#44aa99",
                weight: 2,
                fillColor: "#88cc66",
                fillOpacity: 0.3
            };
        default:
            return {
                color: "#333",
                weight: 1
            };
    }
}
5. 定制点标记展示
对点要素使用圆形标记代替默认图标,使不同类型的地理要素展示更协调:
// 定义点的图标创建函数
function createCustomMarker(feature, latlng) {
    // 如果是点类型且是景点,使用自定义样式的圆形标记
    if (feature.geometry.type === "Point" && feature.properties.type === "景点") {
        return L.circleMarker(latlng, styleFeature(feature));
    }
    // 其他点使用默认标记
    return L.marker(latlng);
}
6. 添加交互弹窗
为每个地理要素绑定弹窗,展示详细信息:
// 定义每个特征的弹出窗口内容
function onEachFeature(feature, layer) {
    // 绑定弹窗
    if (feature.properties && feature.properties.name) {
        layer.bindPopup(`
            <strong>${feature.properties.name}</strong><br>
            类型: ${feature.properties.type}<br>
            ${feature.properties.description}
        `);
    }
}
7. 加载并显示 GeoJSON 数据
将上述配置整合,加载 GeoJSON 数据并添加到地图:
// 加载并显示GeoJSON数据
L.geoJSON(beijingLandmarks, {
    style: styleFeature,  // 应用样式
    pointToLayer: createCustomMarker,  // 自定义点标记
    onEachFeature: onEachFeature  // 为每个特征绑定事件
}).addTo(map);
8. 添加图例控件
创建图例帮助用户理解地图上的符号含义:
// 添加图例控件
const legend = L.control({position: 'bottomright'});

legend.onAdd = function (map) {
    const div = L.DomUtil.create('div', 'legend');

    div.innerHTML = `
        <h4>图例</h4>
        <div class="legend-item">
            <div class="color-box" style="background-color: #ff7800;"></div>
            <span>景点</span>
        </div>
        <div class="legend-item">
            <div class="color-box" style="background-color: #3388ff;"></div>
            <span>道路</span>
        </div>
        <div class="legend-item">
            <div class="color-box" style="background-color: #88cc66;"></div>
            <span>公园</span>
        </div>
    `;

    return div;
};

legend.addTo(map);
四、完整代码实现
<!DOCTYPE html>
<html lang="zh-CN">
<head>
    <meta charset="UTF-8">
    <meta name="viewport" content="width=device-width, initial-scale=1.0">
    <title>Leaflet+高德地图:GeoJSON数据可视化</title>
    <!-- 引入Leaflet资源 -->
    <link rel="stylesheet" href="https://unpkg.com/leaflet@1.9.4/dist/leaflet.css"
          integrity="sha256-p4NxAoJBhIIN+hmNHrzRCf9tD/miZyoHS5obTRR9BMY="
          crossorigin=""/>
    <script src="https://unpkg.com/leaflet@1.9.4/dist/leaflet.js"
            integrity="sha256-20nQCchB9co0qIjJZRGuk2/Z9VM+kNiyxNV1lvTlZBo="
            crossorigin=""></script>
    <style>
        #map {
            width: 100%;
            height: 600px;
        }
        .container {
            max-width: 1200px;
            margin: 20px auto;
            padding: 0 20px;
        }
        .legend {
            background: white;
            padding: 10px;
            border-radius: 5px;
            box-shadow: 0 1px 5px rgba(0,0,0,0.2);
        }
        .legend-item {
            margin-bottom: 5px;
            display: flex;
            align-items: center;
        }
        .color-box {
            width: 15px;
            height: 15px;
            margin-right: 5px;
            border: 1px solid #333;
        }
    </style>
</head>
<body>
    <div class="container">
        <h1>Leaflet+高德地图:GeoJSON数据可视化</h1>
        <div id="map"></div>
        <p>示例展示了GeoJSON格式的点、线、面地理要素在高德地图上的可视化效果</p>
    </div>

    <script>
        // 初始化地图
        const map = L.map('map').setView([39.9042, 116.4074], 12);

        // 添加高德标准地图图层
        L.tileLayer('https://webrd0{s}.is.autonavi.com/appmaptile?lang=zh_cn&size=1&scale=1&style=8&x={x}&y={y}&z={z}', {
            subdomains: ['1', '2', '3', '4'],
            attribution: '© 高德地图'
        }).addTo(map);

        // 1. 定义示例GeoJSON数据
        const beijingLandmarks = {
            "type": "FeatureCollection",
            "features": [
                // 点特征 - 著名景点
                {
                    "type": "Feature",
                    "properties": {
                        "name": "天安门广场",
                        "type": "景点",
                        "description": "北京市中心的城市广场"
                    },
                    "geometry": {
                        "type": "Point",
                        "coordinates": [116.397470, 39.908823]  // GeoJSON坐标是[经度, 纬度]
                    }
                },
                {
                    "type": "Feature",
                    "properties": {
                        "name": "故宫博物院",
                        "type": "景点",
                        "description": "中国明清两代的皇家宫殿"
                    },
                    "geometry": {
                        "type": "Point",
                        "coordinates": [116.390812, 39.916365]
                    }
                },
                // 线特征 - 主要道路
                {
                    "type": "Feature",
                    "properties": {
                        "name": "长安街",
                        "type": "道路",
                        "description": "北京市中心的东西向主要街道"
                    },
                    "geometry": {
                        "type": "LineString",
                        "coordinates": [
                            [116.3700, 39.9075],
                            [116.3850, 39.9075],
                            [116.4000, 39.9075],
                            [116.4150, 39.9075],
                            [116.4300, 39.9075]
                        ]
                    }
                },
                // 面特征 - 公园区域
                {
                    "type": "Feature",
                    "properties": {
                        "name": "天坛公园",
                        "type": "公园",
                        "description": "明清两代皇帝祭天、祈谷的场所"
                    },
                    "geometry": {
                        "type": "Polygon",
                        "coordinates": [
                            [
                                [116.4183, 39.8822],
                                [116.4283, 39.8822],
                                [116.4283, 39.8722],
                                [116.4183, 39.8722],
                                [116.4183, 39.8822]
                            ]
                        ]
                    }
                }
            ]
        };

        // 2. 定义样式函数 - 根据特征类型设置不同样式
        function styleFeature(feature) {
            switch (feature.properties.type) {
                case "景点":
                    return {
                        radius: 8,
                        fillColor: "#ff7800",
                        color: "#000",
                        weight: 1,
                        opacity: 1,
                        fillOpacity: 0.8
                    };
                case "道路":
                    return {
                        color: "#3388ff",
                        weight: 5,
                        opacity: 0.7
                    };
                case "公园":
                    return {
                        color: "#44aa99",
                        weight: 2,
                        fillColor: "#88cc66",
                        fillOpacity: 0.3
                    };
                default:
                    return {
                        color: "#333",
                        weight: 1
                    };
            }
        }

        // 3. 定义点的图标创建函数
        function createCustomMarker(feature, latlng) {
            // 如果是点类型且是景点,使用自定义样式的圆形标记
            if (feature.geometry.type === "Point" && feature.properties.type === "景点") {
                return L.circleMarker(latlng, styleFeature(feature));
            }
            // 其他点使用默认标记
            return L.marker(latlng);
        }

        // 4. 定义每个特征的弹出窗口内容
        function onEachFeature(feature, layer) {
            // 绑定弹窗
            if (feature.properties && feature.properties.name) {
                layer.bindPopup(`
                    <strong>${feature.properties.name}</strong><br>
                    类型: ${feature.properties.type}<br>
                    ${feature.properties.description}
                `);
            }
        }

        // 5. 加载并显示GeoJSON数据
        L.geoJSON(beijingLandmarks, {
            style: styleFeature,  // 应用样式
            pointToLayer: createCustomMarker,  // 自定义点标记
            onEachFeature: onEachFeature  // 为每个特征绑定事件
        }).addTo(map);

        // 6. 添加图例控件
        const legend = L.control({position: 'bottomright'});

        legend.onAdd = function (map) {
            const div = L.DomUtil.create('div', 'legend');

            div.innerHTML = `
                <h4>图例</h4>
                <div class="legend-item">
                    <div class="color-box" style="background-color: #ff7800;"></div>
                    <span>景点</span>
                </div>
                <div class="legend-item">
                    <div class="color-box" style="background-color: #3388ff;"></div>
                    <span>道路</span>
                </div>
                <div class="legend-item">
                    <div class="color-box" style="background-color: #88cc66;"></div>
                    <span>公园</span>
                </div>
            `;

            return div;
        };

        legend.addTo(map);
    </script>
</body>
</html>
五、进阶技巧与最佳实践
1. 加载外部 GeoJSON 数据
实际项目中,GeoJSON 数据通常从服务器加载:
// 从外部文件加载GeoJSON
fetch('data/beijing-landmarks.geojson')
    .then(response => response.json())
    .then(data => {
        L.geoJSON(data, {
            // 配置参数与之前相同
            style: styleFeature,
            pointToLayer: createCustomMarker,
            onEachFeature: onEachFeature
        }).addTo(map);
    })
    .catch(error => console.error('加载GeoJSON失败:', error));
2. 数据过滤与筛选
可通过filter选项实现数据筛选:
// 只显示"景点"类型的要素
L.geoJSON(beijingLandmarks, {
    filter: function(feature) {
        return feature.properties.type === "景点";
    },
    // 其他配置...
}).addTo(map);
3. 动态样式更新
根据数据属性动态更新样式,实现数据可视化效果:
// 假设features有population属性,根据人口数量设置颜色
function styleByPopulation(feature) {
    const population = feature.properties.population || 0;
    let color = "#ffffcc";
    if (population > 100000) color = "#ff4444";
    else if (population > 50000) color = "#ffbb33";
    else if (population > 10000) color = "#ffff99";

    return {
        fillColor: color,
        weight: 1,
        fillOpacity: 0.7
    };
}
4. 性能优化
处理大量 GeoJSON 数据时的优化技巧:
- 使用
L.geoJson(data, { simplifyFactor: 0.5 })简化几何图形 - 对大规模点数据使用标记聚类插件(如
Leaflet.markercluster) - 实现数据分页加载或视口加载(只加载当前视野内的数据)
5. 高德地图配合使用注意事项
- 高德地图的坐标系是 GCJ-02(国测局坐标系),而标准 GeoJSON 可能使用 WGS84 坐标系
- 若出现坐标偏移,需进行坐标系转换(可使用第三方库如
proj4js) - 商业应用需遵守高德地图服务条款,大规模使用需申请授权
六、总结
本文详细介绍了在 Leaflet 中结合高德地图实现 GeoJSON 数据可视化的完整流程,包括:
- 高德地图图层的初始化与配置
- GeoJSON 数据结构与格式解析
- 地理要素的样式定制(点、线、面)
- 交互功能实现(弹窗、图例)
- 进阶技巧与性能优化
宝子们加加关注,有需要的在评论区留言;后续可进一步学习 Leaflet 的扩展插件,如热力图、路径分析等功能,不断丰富地图应用的可视化能力。

腾讯云面向开发者汇聚海量精品云计算使用和开发经验,营造开放的云计算技术生态圈。
更多推荐
 29
29 0
0- 0


 已为社区贡献2条内容

所有评论(0)