Go+Vue3开发web应用项目和数据可视化大屏素材推荐
·
说明
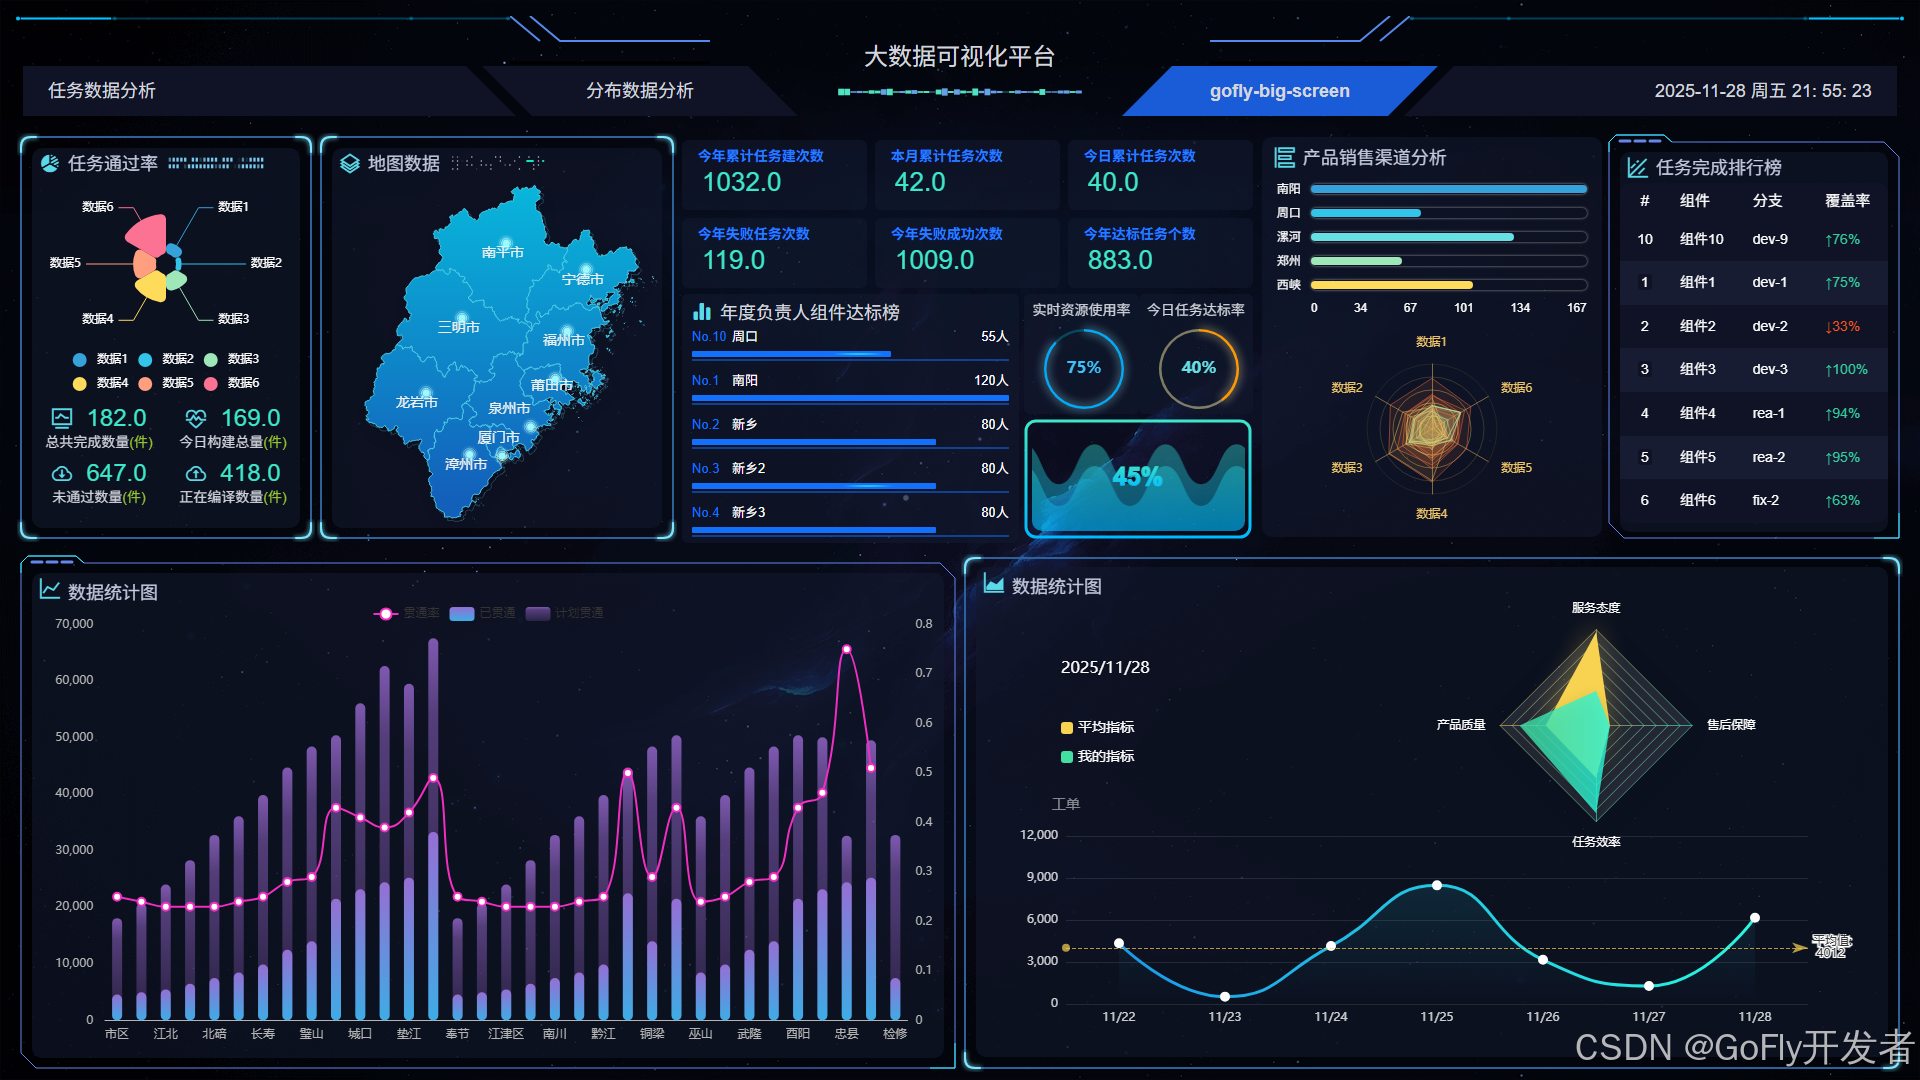
数据可视化大屏 基于 Vue3、Typescript、DataV、ECharts5 框架的大数据可视化(大屏展示)开发。此项目vue3实现界面,采用新版动态屏幕适配方案,全局渲染组件封装,支持数据动态刷新渲染、内部DataV、ECharts图表都支持自由替换。框架做好各种尺寸屏幕适配,这样大家就在模板上设计自己业务,不用关系屏幕适配问题,而且DataV有各种常见布局组件帮助大家快速快发。
先看效果图

大屏插件代码地址:
数据可视化大屏-1:https://goflys.cn/codedetail?id=31
数据可视化大屏-2:https://goflys.cn/codedetail?id=88
使用
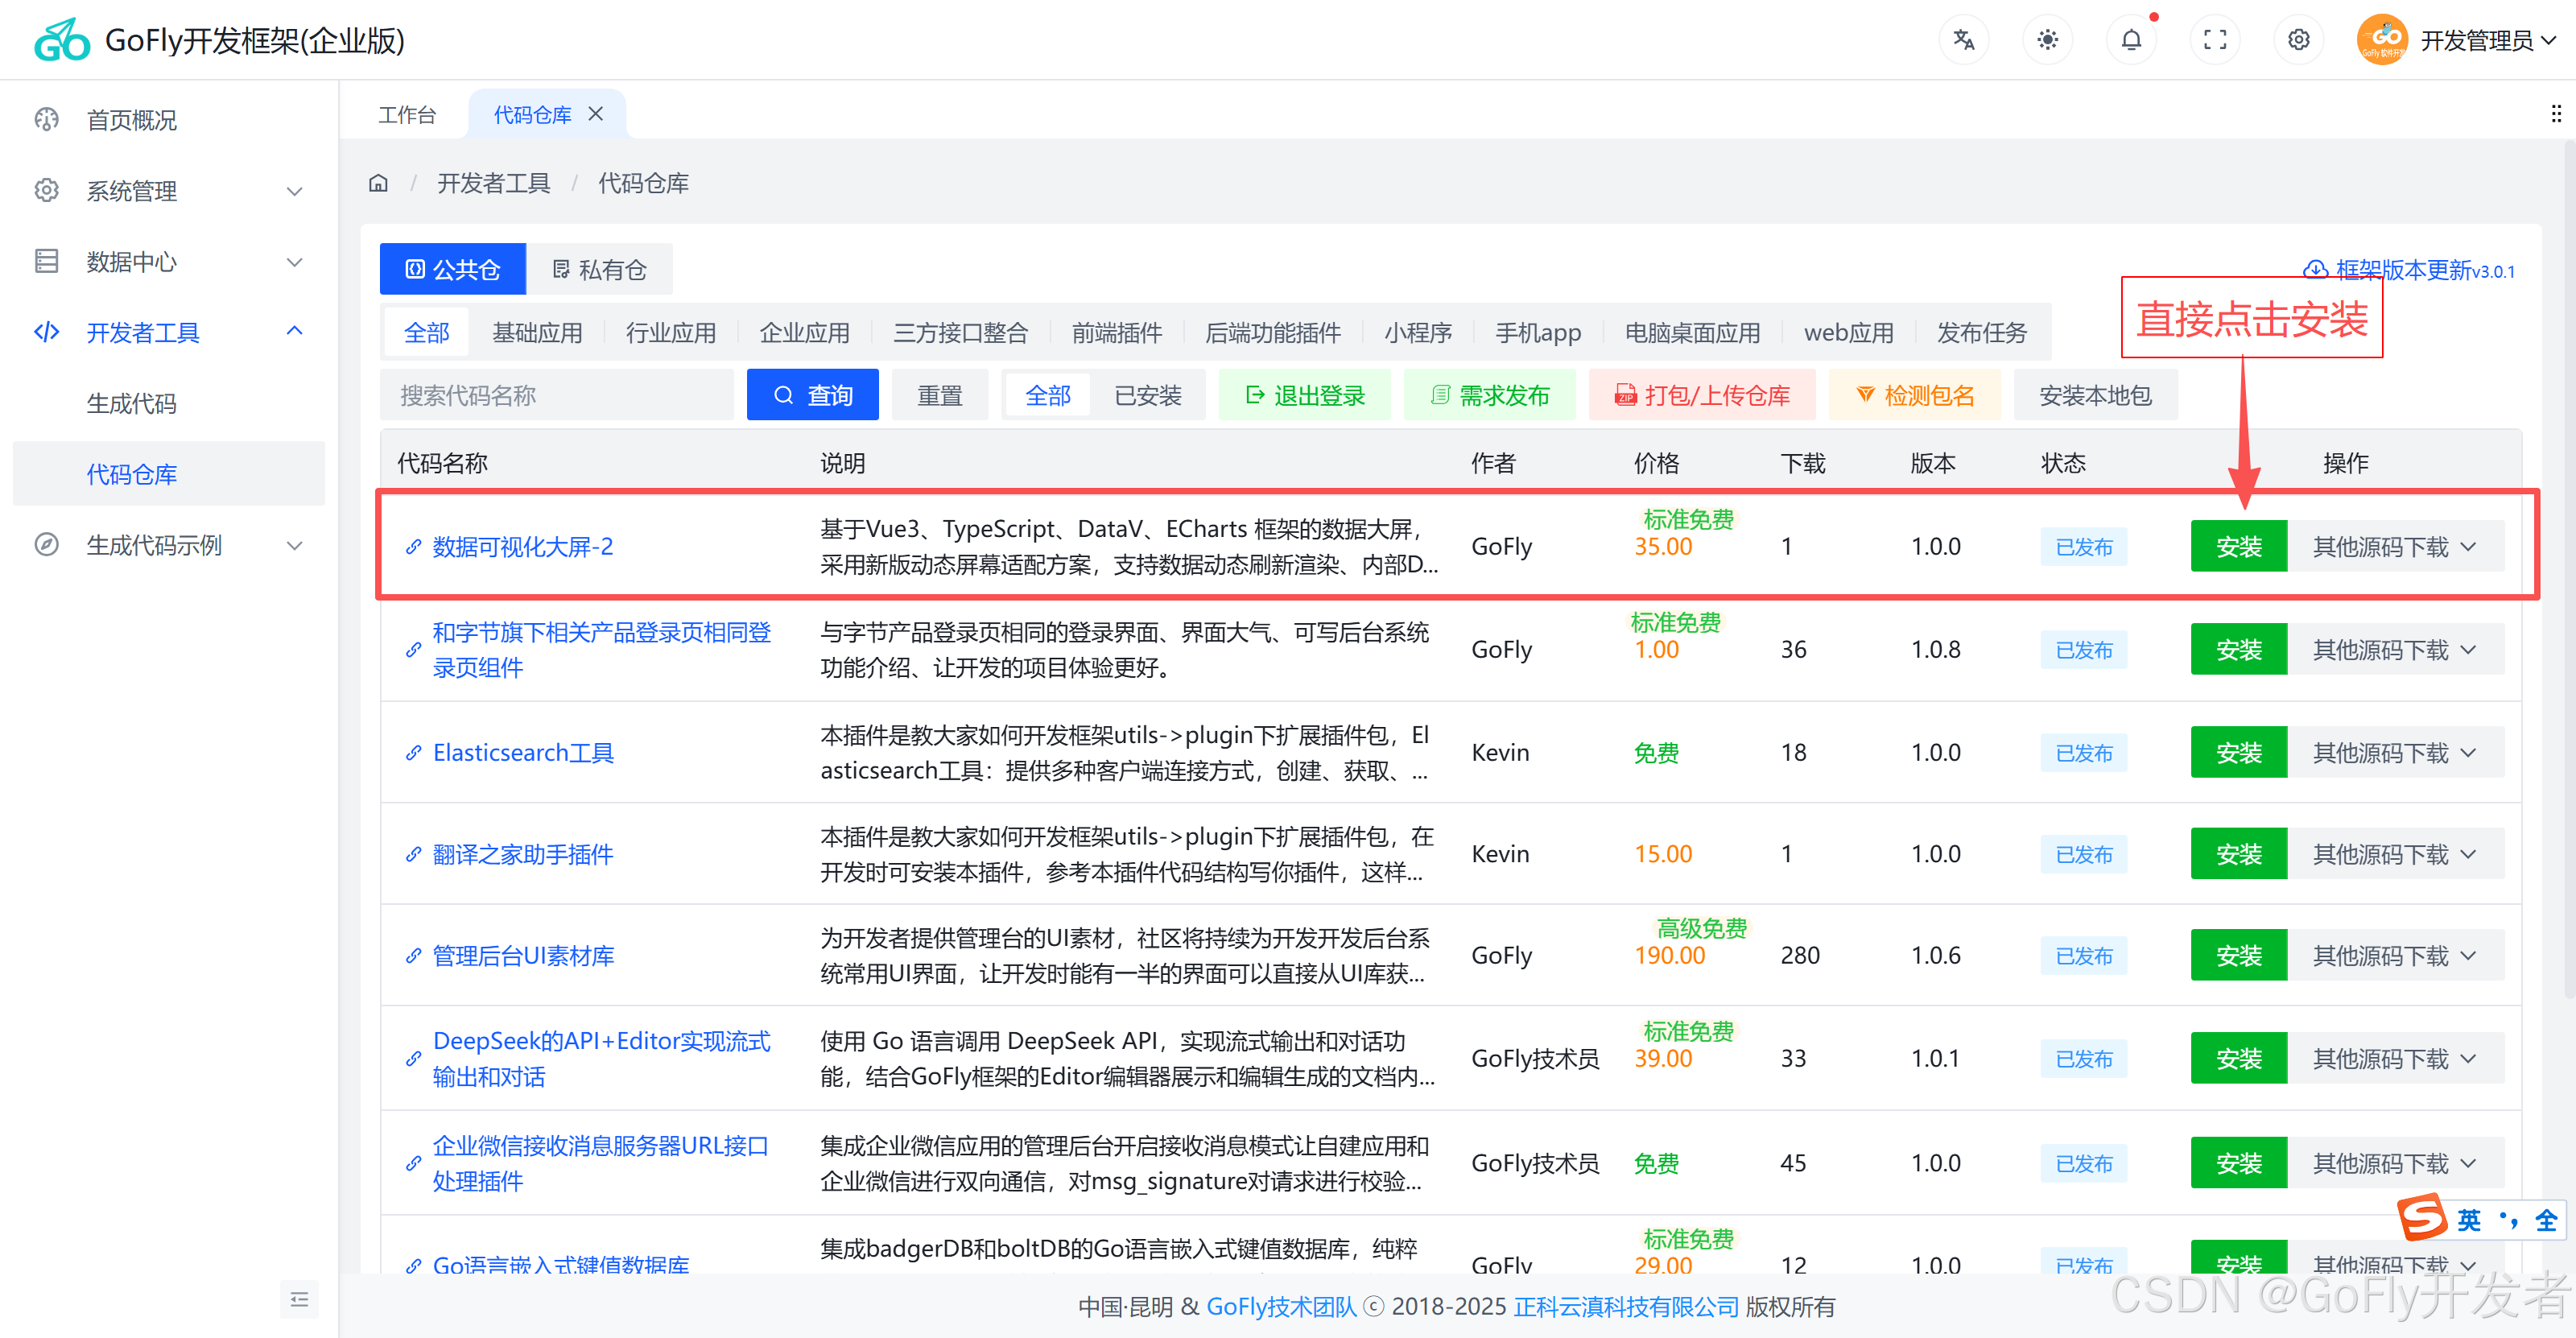
在开发者工具的代码包,点击安装
安装dataV插件
pnpm install @kjgl77/datav-vue3或者
yarn add @kjgl77/datav-vue3在package.json中新增:
"dependencies": {
++
"@kjgl77/datav-vue3": "^1.7.3",
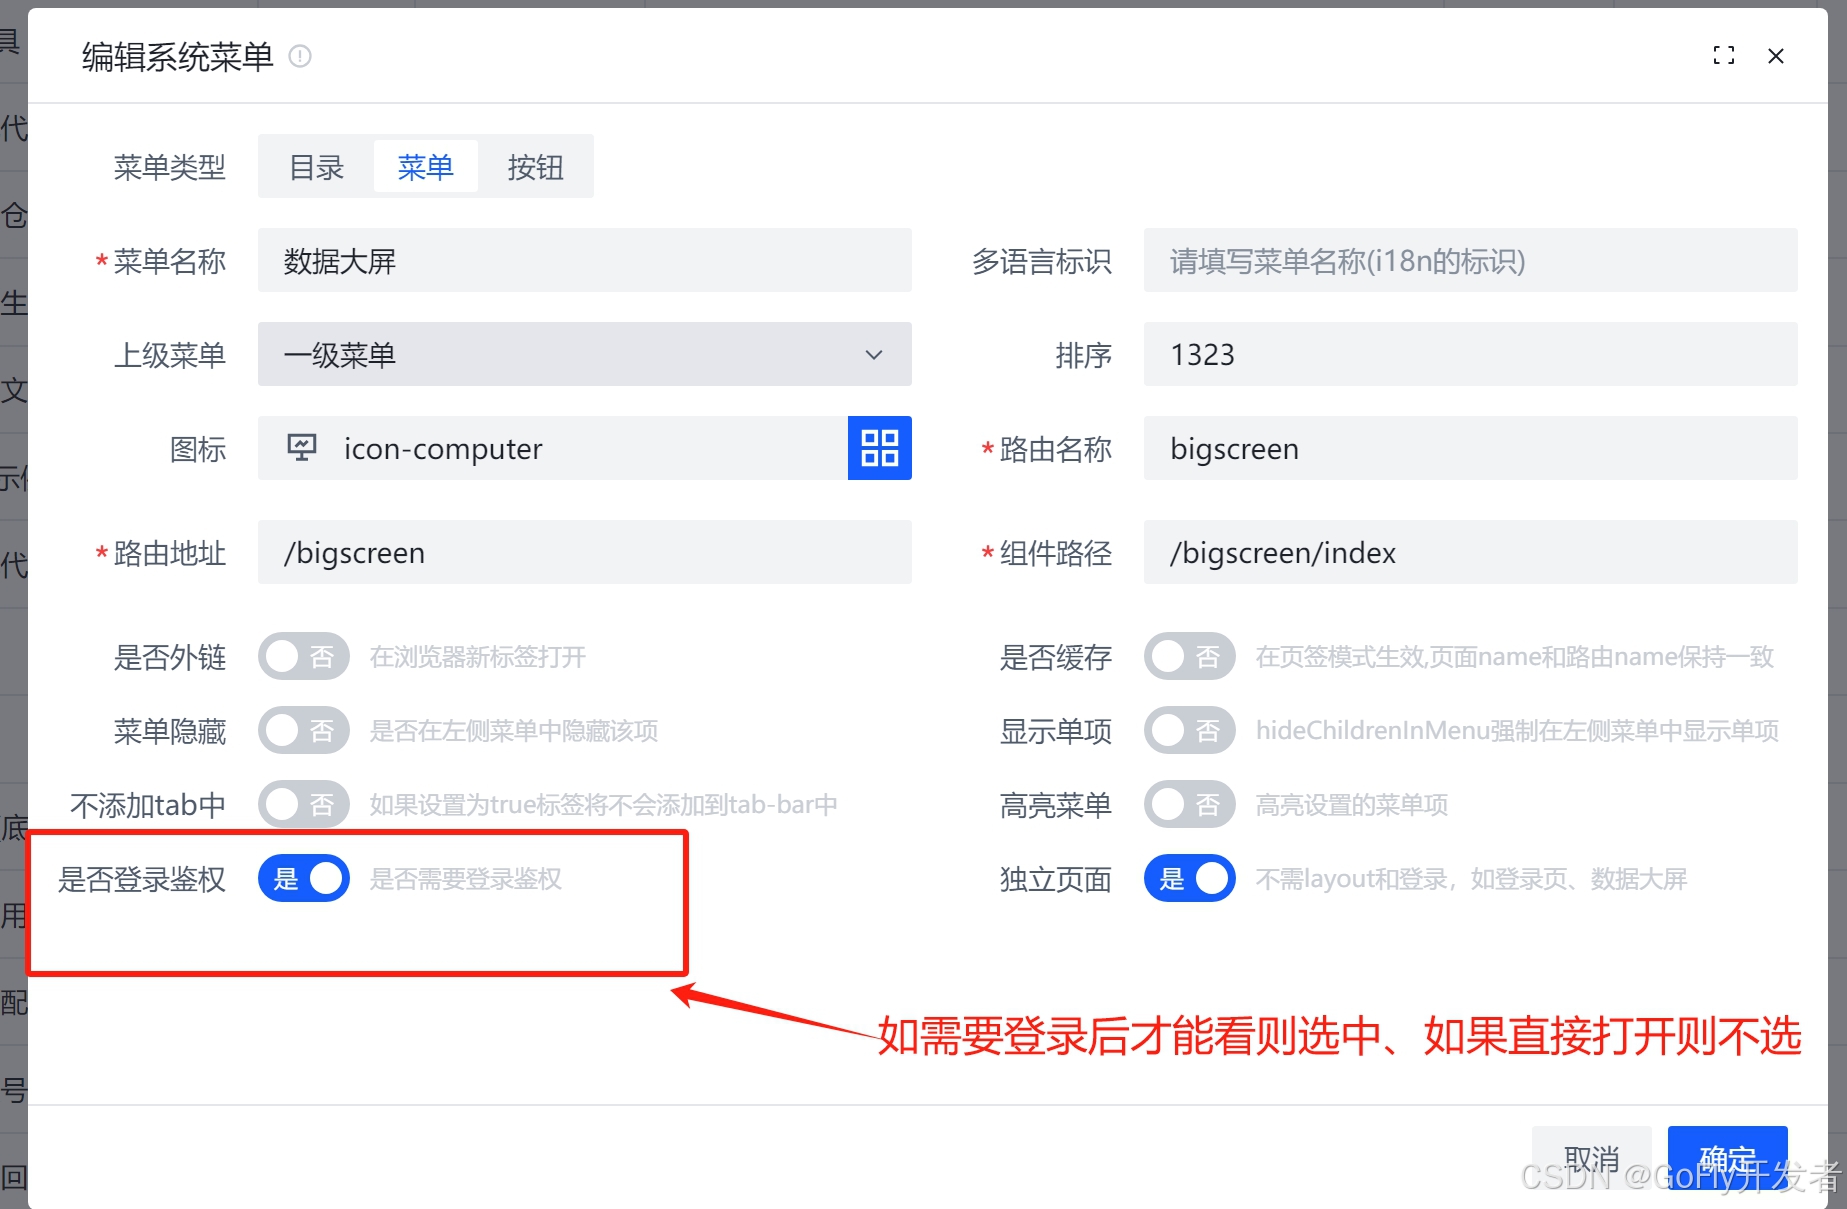
}菜单社区说明:
这个功能要做v2.5.2框架版本之后才是生效。
开发文档
请参考文档开发
开发指导
1.安装后前端的文件目录
当你安装插件后,代码在src\views\dataview目录中。
 dataview               # 插件目录
├── assets           # 资源包,如图片、icon、css、地图数据等
├── components       # 组件包
├── constant         # 模拟数据
├── utils            # 工具函数
└── index.vue        # 主页面
2.DataV组件使用
引入如下
import {
  Loading as DvLoading,
  BorderBox12 as DvBorderBox12,
  BorderBox13 as DvBorderBox13,
  Decoration6 as DvDecoration6,
  Decoration8 as DvDecoration8,
  Decoration10 as DvDecoration10,
} from '@kjgl77/datav-vue3'
使用标签
<template>
   <dv-loading v-if="loading">Loading...</dv-loading>
  <dv-decoration-10 class="dv-dec-10" />
</template>
3.使用ECharts
ECharts图表封装在src\views\dataview\components\ReEcharts\index.vue中统一调用,减少开发复杂度,调用如下:
<template>
  <div class="bottomRight">
    <div class="bg-color-black">
      <div class="d-flex pt-2 pl-2">
        <span>
          <i class="iconfont icon-chart-area"  ></i>
        </span>
        <div class="d-flex">
          <span class="fs-xl text mx-2 mt-1">数据统计图</span>
        </div>
      </div>
      <div>
         <Echarts ref="chartRef" height="480px" width="100%" :option="options" />
      </div>
    </div>
  </div>
</template>

<script lang="ts" setup>
import { ref, onMounted,onUnmounted} from 'vue'
import Echarts from '../ReEcharts/index.vue';
// 定义 ref
const chartRef = ref()
const loading=ref(false);
// 定义颜色
  const colorList = {
    linearYtoG: {
      type: "linear",
      x: 0,
      y: 0,
      x2: 1,
      y2: 1,
      colorStops: [
        {
          offset: 0,
          color: "#f5b44d"
        },
        {
          offset: 1,
          color: "#28f8de"
        }
      ]
    },
    linearGtoB: {
      type: "linear",
      x: 0,
      y: 0,
      x2: 1,
      y2: 0,
      colorStops: [
        {
          offset: 0,
          color: "#43dfa2"
        },
        {
          offset: 1,
          color: "#28f8de"
        }
      ]
    },
    linearBtoG: {
      type: "linear",
      x: 0,
      y: 0,
      x2: 1,
      y2: 0,
      colorStops: [
        {
          offset: 0,
          color: "#1c98e8"
        },
        {
          offset: 1,
          color: "#28f8de"
        }
      ]
    },
    areaBtoG: {
      type: "linear",
      x: 0,
      y: 0,
      x2: 0,
      y2: 1,
      colorStops: [
        {
          offset: 0,
          color: "rgba(35,184,210,.2)"
        },
        {
          offset: 1,
          color: "rgba(35,184,210,0)"
        }
      ]
    }
  }
  const drawTiming = ref<any>(0)
  const cdata = ref<any>({
    year: null,
    weekCategory: [],
    radarData: [],
    radarDataAvg: [],
    maxData: 12000,
    weekMaxData: [],
    weekLineData: []
  })
    // 配置项
  let options ={}
  // methods
  const setData = async() => {
      // 清空轮询数据
      cdata.value.weekCategory = [];
      cdata.value.weekMaxData = [];
      cdata.value.weekLineData = [];
      cdata.value.radarData = [];
      cdata.value.radarDataAvg = [];

      const dateBase = new Date();
      cdata.value.year = dateBase.getFullYear();
      // 周数据
      for (let i = 0; i < 7; i++) {
        // 日期
        const date = new Date();
        cdata.value.weekCategory.unshift([date.getMonth() + 1, date.getDate() - i].join("/"));

        // 折线图数据
        cdata.value.weekMaxData.push(cdata.value.maxData);
        const distance = Math.round(Math.random() * 11000 + 500);
        cdata.value.weekLineData.push(distance);

        // 雷达图数据
        // 我的指标
        const averageSpeed = +(Math.random() * 5 + 3).toFixed(3);
        const maxSpeed = averageSpeed + +(Math.random() * 3).toFixed(2);
        const hour = +(distance / 1000 / averageSpeed).toFixed(1);
        const radarDayData = [distance, averageSpeed, maxSpeed, hour];
        cdata.value.radarData.unshift(radarDayData);

        // 平均指标
        const distanceAvg = Math.round(Math.random() * 8000 + 4000);
        const averageSpeedAvg = +(Math.random() * 4 + 4).toFixed(3);
        const maxSpeedAvg = averageSpeedAvg + +(Math.random() * 2).toFixed(2);
        const hourAvg = +(distance / 1000 / averageSpeed).toFixed(1);
        const radarDayDataAvg = [
          distanceAvg,
          averageSpeedAvg,
          maxSpeedAvg,
          hourAvg
        ];
        cdata.value.radarDataAvg.unshift(radarDayDataAvg);
      }
      options=await GetOptions(cdata.value)
      if (chartRef.value) {
        // 通过初始化参数打入数据
        chartRef.value.setChart(options)
      }
      loading.value=true
    }

  // 定时函数
  const drawTimingFn = () => {
    setData();
    drawTiming.value = setInterval(() => {
      setData();
    }, 6000);
  }

  // 生命周期
  onMounted(() => {
    drawTimingFn()
  })
  onUnmounted(() => {
    clearInterval(drawTiming.value)
  })
 const GetOptions =(cdata:any)=>{
  return {
    title: {
      text: "",
      textStyle: {
        color: "#D3D6DD",
        fontSize: 24,
        fontWeight: "normal"
      },
      subtext: cdata.year + "/" + cdata.weekCategory[6],
      subtextStyle: {
        color: "#fff",
        fontSize: 16
      },
      top: 50,
      left: 80
    },
    legend: {
      top: 120,
      left: 80,
      orient: "vertical",
      itemGap: 15,
      itemWidth: 12,
      itemHeight: 12,
      data: ["平均指标", "我的指标"],
      textStyle: {
        color: "#fff",
        fontSize: 14
      }
    },
    tooltip: {
      trigger: "item"
    },
    radar: {
      center: ["68%", "27%"],
      radius: "40%",
      name: {
        color: "#fff"
      },
      splitNumber: 8,
      axisLine: {
        lineStyle: {
          color: colorList.linearYtoG,
          opacity: 0.6
        }
      },
      splitLine: {
        lineStyle: {
          color: colorList.linearYtoG,
          opacity: 0.6
        }
      },
      splitArea: {
        areaStyle: {
          color: "#fff",
          opacity: 0.1,
          shadowBlur: 25,
          shadowColor: "#000",
          shadowOffsetX: 0,
          shadowOffsetY: 5
        }
      },
      indicator: [
        {
          name: "服务态度",
          max: cdata.maxData
        },
        {
          name: "产品质量",
          max: 10
        },
        {
          name: "任务效率",
          max: 12
        },
        {
          name: "售后保障",
          max: 3.5
        }
      ]
    },
    grid: {
      left: 90,
      right: 80,
      bottom: '15%',
      top: "50%"
    },
    xAxis: {
      type: "category",
      position: "bottom",
      axisLine: true,
      axisLabel: {
        color: "rgba(255,255,255,.8)",
        fontSize: 12
      },
      data: cdata.weekCategory
    },
    // 下方Y轴
    yAxis: {
      name: "工单",
      nameLocation: "end",
      nameGap: 24,
      nameTextStyle: {
        color: "rgba(255,255,255,.5)",
        fontSize: 14
      },
      max: cdata.maxData,
      splitNumber: 4,

      axisLine: {
        lineStyle: {
          opacity: 0
        }
      },
      splitLine: {
        show: true,
        lineStyle: {
          color: "#fff",
          opacity: 0.1
        }
      },
      axisLabel: {
        color: "rgba(255,255,255,.8)",
        fontSize: 12
      }
    },
    series: [
      {
        name: "",
        type: "radar",
        symbolSize: 0,
        data: [
          {
            value: cdata.radarDataAvg[6],
            name: "平均指标",
            itemStyle: {
              normal: {
                color: "#f8d351"
              }
            },
            lineStyle: {
              normal: {
                opacity: 0
              }
            },
            areaStyle: {
              normal: {
                color: "#f8d351",
                shadowBlur: 25,
                shadowColor: "rgba(248,211,81,.3)",
                shadowOffsetX: 0,
                shadowOffsetY: -10,
                opacity: 1
              }
            }
          },
          {
            value: cdata.radarData[6],
            name: "我的指标",
            itemStyle: {
              normal: {
                color: "#43dfa2"
              }
            },
            lineStyle: {
              normal: {
                opacity: 0
              }
            },
            areaStyle: {
              normal: {
                color: colorList.linearGtoB,
                shadowBlur: 15,
                shadowColor: "rgba(0,0,0,.2)",
                shadowOffsetX: 0,
                shadowOffsetY: 5,
                opacity: 0.8
              }
            }
          }
        ]
      },
      {
        name: "",
        type: "line",
        smooth: true,
        symbol: "emptyCircle",
        symbolSize: 8,
        itemStyle: {
          normal: {
            color: "#fff"
          }
        },
        lineStyle: {
          normal: {
            color: colorList.linearBtoG,
            width: 3
          }
        },
        areaStyle: {
          normal: {
            color: colorList.areaBtoG
          }
        },
        data: cdata.weekLineData,
        lineSmooth: true,
        markLine: {
          silent: true,
          data: [
            {
              type: "average",
              name: "平均值"
            }
          ],
          precision: 0,
          label: {
            normal: {
              formatter: "平均值: \n {c}"
            }
          },
          lineStyle: {
            normal: {
              color: "rgba(248,211,81,.7)"
            }
          }
        },
        tooltip: {
          position: "top",
          formatter: "{c} m",
          backgroundColor: "rgba(28,152,232,.2)",
          padding: 6
        }
      },
      {
        name: "占位背景",
        type: "bar",
        itemStyle: {
          normal: {
            show: true,
            color: "#000",
            opacity: 0
          }
        },
        silent: true,
        barWidth: "50%",
        data: cdata.weekMaxData,
        animation: false
      }
    ]
  }
 }
</script>

<style lang="less" class>
@box-height: 520px;
@box-width: 100%;
.bottomRight {
  padding: 14px 16px;
  height: @box-height;
  width: @box-width;
  border-radius: 5px;
  .bg-color-black {
    height: @box-height - 30px;
    border-radius: 10px;
  }
  .text {
    color: #c3cbde;
  }
  .chart-box {
    margin-top: 16px;
    width: 170px;
    height: 170px;
    .active-ring-name {
      padding-top: 10px;
    }
  }
}
</style>
腾讯云面向开发者汇聚海量精品云计算使用和开发经验,营造开放的云计算技术生态圈。
更多推荐
 29
29 0
0- 0


 已为社区贡献8条内容

所有评论(0)