python - 抓取汇率数据分析美元和欧元对RMB的变化曲线
·
数据:
实例:
import requests
payload = {
    'projectBean.startDate' : '2017-06-18',
    'projectBean.endDate' : '2017-09-18',
    'queryYN' : 'true'
}
response = requests.post('http://www.safe.gov.cn/AppStructured/view/project_RMBQuery.action',
                        data=payload)
html = response.text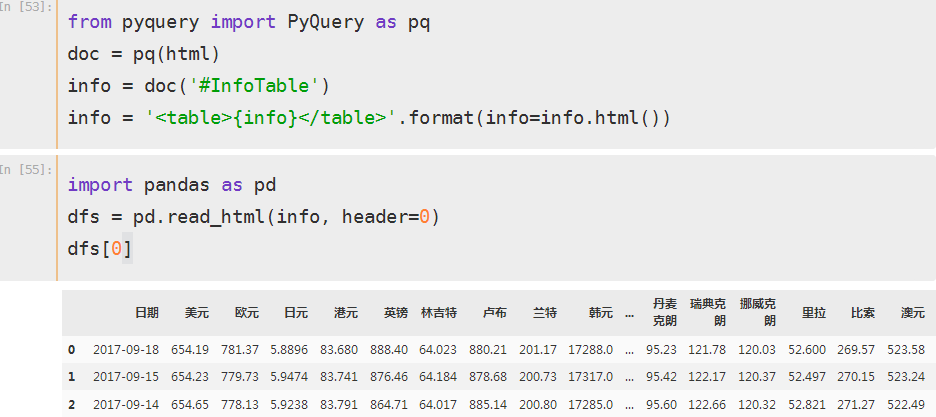
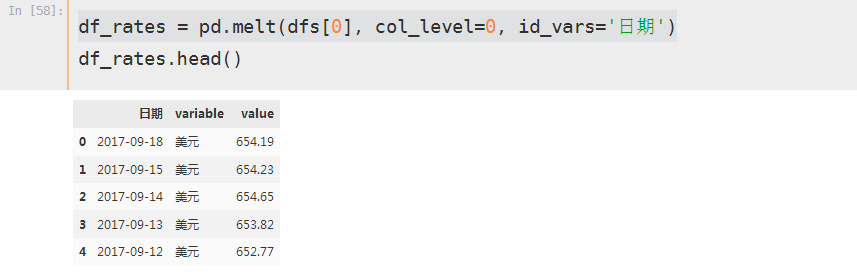
import sqlite3 as db
with db.connect('currency.sqlite') as con:
    df_rates.to_sql('currency_data', con=con, if_exists='replace', index=None)
from datetime import datetime, timedelta
current_time = datetime.now()
for i in range(0, 300, 31):
# 为了避免重复,range T - days T = 1
start_date = (current_time - timedelta(days = i + 30)).strftime('%Y-%m-%d')
end_date = (current_time - timedelta(days = i)).strftime('%Y-%m-%d')
def get_currency(start, end):
    payload = {
    'projectBean.startDate' : start,
    'projectBean.endDate' : end,
    'queryYN' : 'true'
    }
    response = requests.post('http://www.safe.gov.cn/AppStructured/view/project_RMBQuery.action',
                            data=payload)
    html = response.text
    doc = pq(html)
    info = '<table>{info}</table>'.format(info=doc('#InfoTable').html())
    dfs = pd.read_html(info, header=0)
    df_rates = pd.melt(dfs[0], col_level=0, id_vars='日期')
    df_rates.columns = ['date', 'currency', 'exchange']
    with db.connect('currency.sqlite') as con:
        df_rates.to_sql('currency_data', con=con, if_exists='append', index=None)

current_time = datetime.now()
for i in range(0, 300, 31):
    # 为了避免重复,range T - days T = 1
    start_date = (current_time - timedelta(days = i + 30)).strftime('%Y-%m-%d')
    end_date = (current_time - timedelta(days = i)).strftime('%Y-%m-%d')
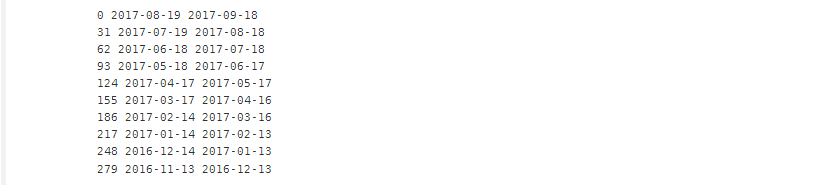
    print(i, start_date, end_date)
    get_currency(start_date, end_date)
with db.connect('currency.sqlite') as con:
df = pd.read_sql('select * from currency_data where currency = "美元"', con=con) 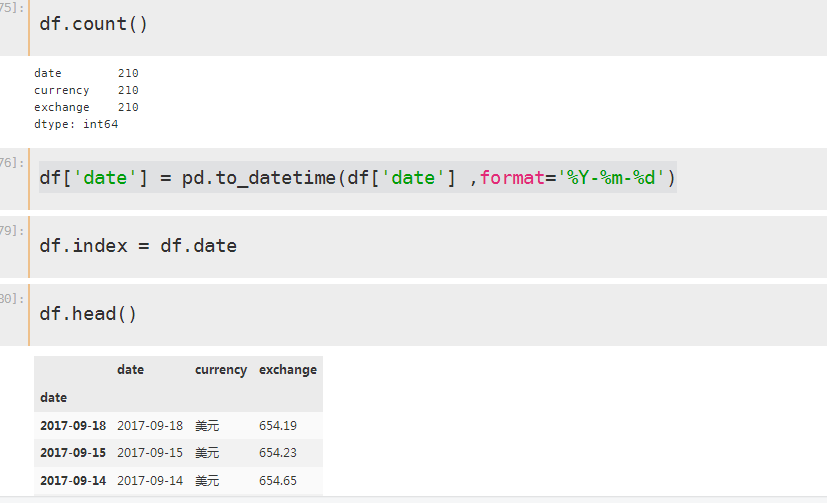
% pylab  inline
df.plot(kind='line', rot=30)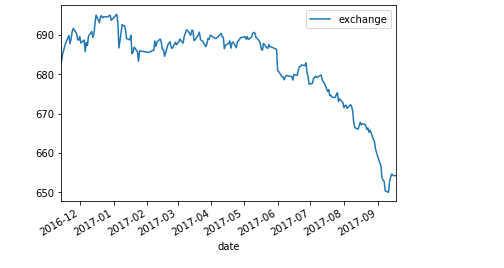
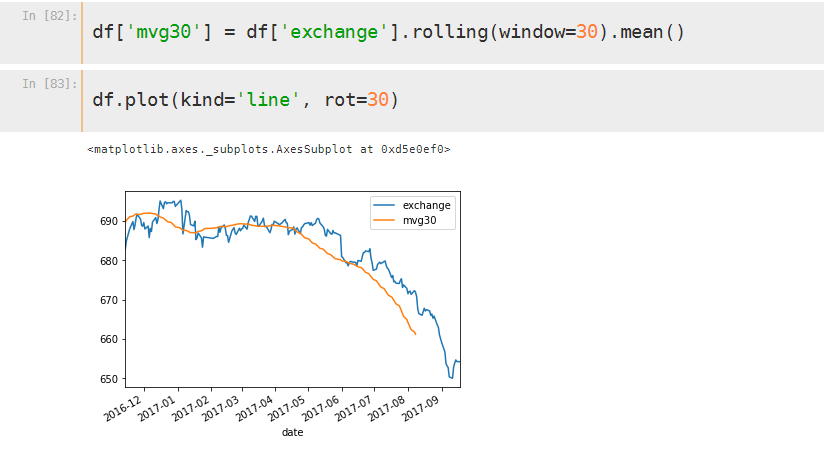
with db.connect('currency.sqlite') as con:
    df = pd.read_sql('select * from currency_data where currency in ("美元", "英镑")', con=con)
df['date'] = pd.to_datetime(df['date'] ,format='%Y-%m-%d')
df.info()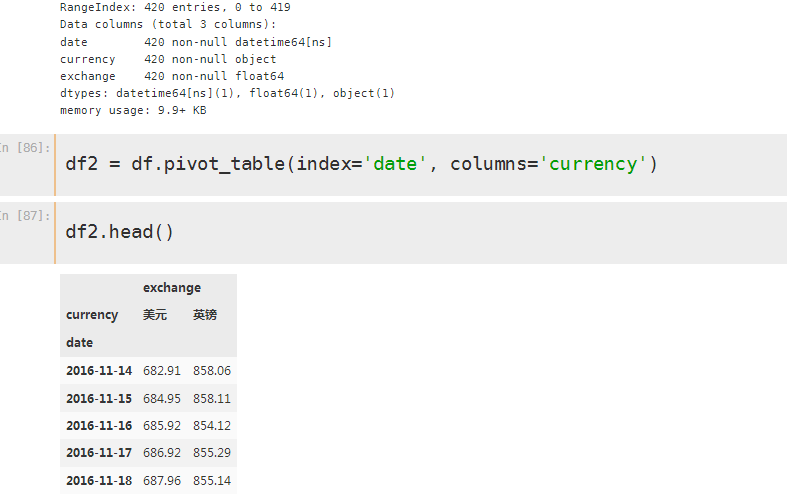
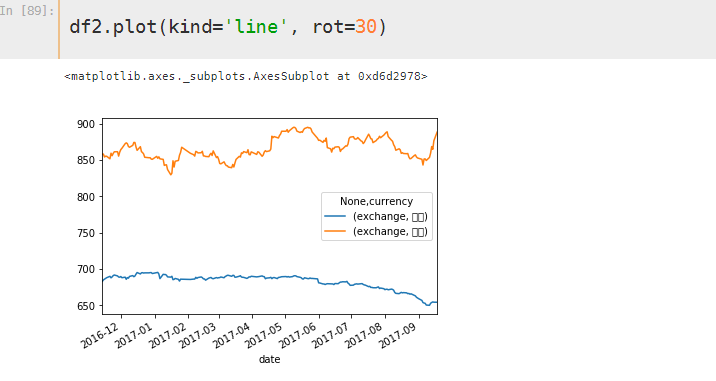

腾讯云面向开发者汇聚海量精品云计算使用和开发经验,营造开放的云计算技术生态圈。
更多推荐
 0
0 0
0- 0


 已为社区贡献4条内容

所有评论(0)