cnn神经网络卷积层可视化
·
cnn神经网络卷积层可视化
1.修改model.py文件的定义网络输出函数
def inference(images,batch_size, n_classes):
###你的卷积层、全连接层、softmax层定义
    return softmax_linear,conv1,conv2
2.修改测试函数
logit ,conv1,conv2= model.inference(image,BATCH_SIZE,n_class)
with tf.Session() as sess:
    ckpt = tf.train.get_checkpoint_state(logits_train_dir)#读取训练好的参数
    if ckpt and ckpt.model_checkpoint_path:
        global_step = ckpt.model_checkpoint_path.split('/')[-1].split('-')[-1]
        saver.restore(sess,ckpt.model_checkpoint_path)
        print('loading sucess,global-step is %s' % global_step)
    else:
        print('No checkpoint file found')
    conv1 = sess.run(conv1,feed_dict={x: image_array})#计算第一层卷积输出
    conv2 = sess.run(conv2,feed_dict={x: image_array})#计算第二层卷积输出
3.输出卷积层结果
    fig, axes = plt.subplots(4, 4, figsize=(6, 6),
                         subplot_kw={'xticks': [], 'yticks': []})

    fig.subplots_adjust(left=0.02, bottom=0.06, right=0.95, top=0.94, wspace=0.05)
    for i,ax in zip(range(16), axes.flat):
        ax.imshow(conv2[0,:,:,i])
    plt.show()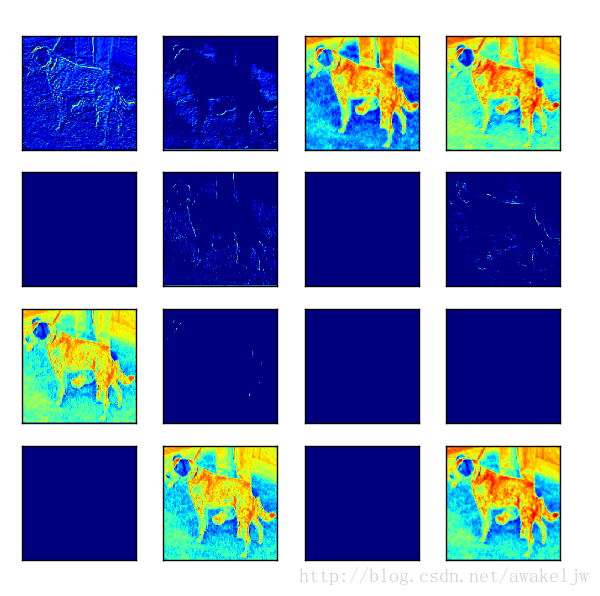

腾讯云面向开发者汇聚海量精品云计算使用和开发经验,营造开放的云计算技术生态圈。
更多推荐
 1
 0
- 0


 已为社区贡献4条内容

所有评论(0)