ELFK收集Nginx日志实践
·
ELK收集Nginx日志实践
Nginx日志收集思路
1.首先通过Filebeat读取日志文件中的内容,并且将内容发送给Logstash;
2.Logstash接收到数据后,对数据进行处理,然后输出给Elasticsearch;
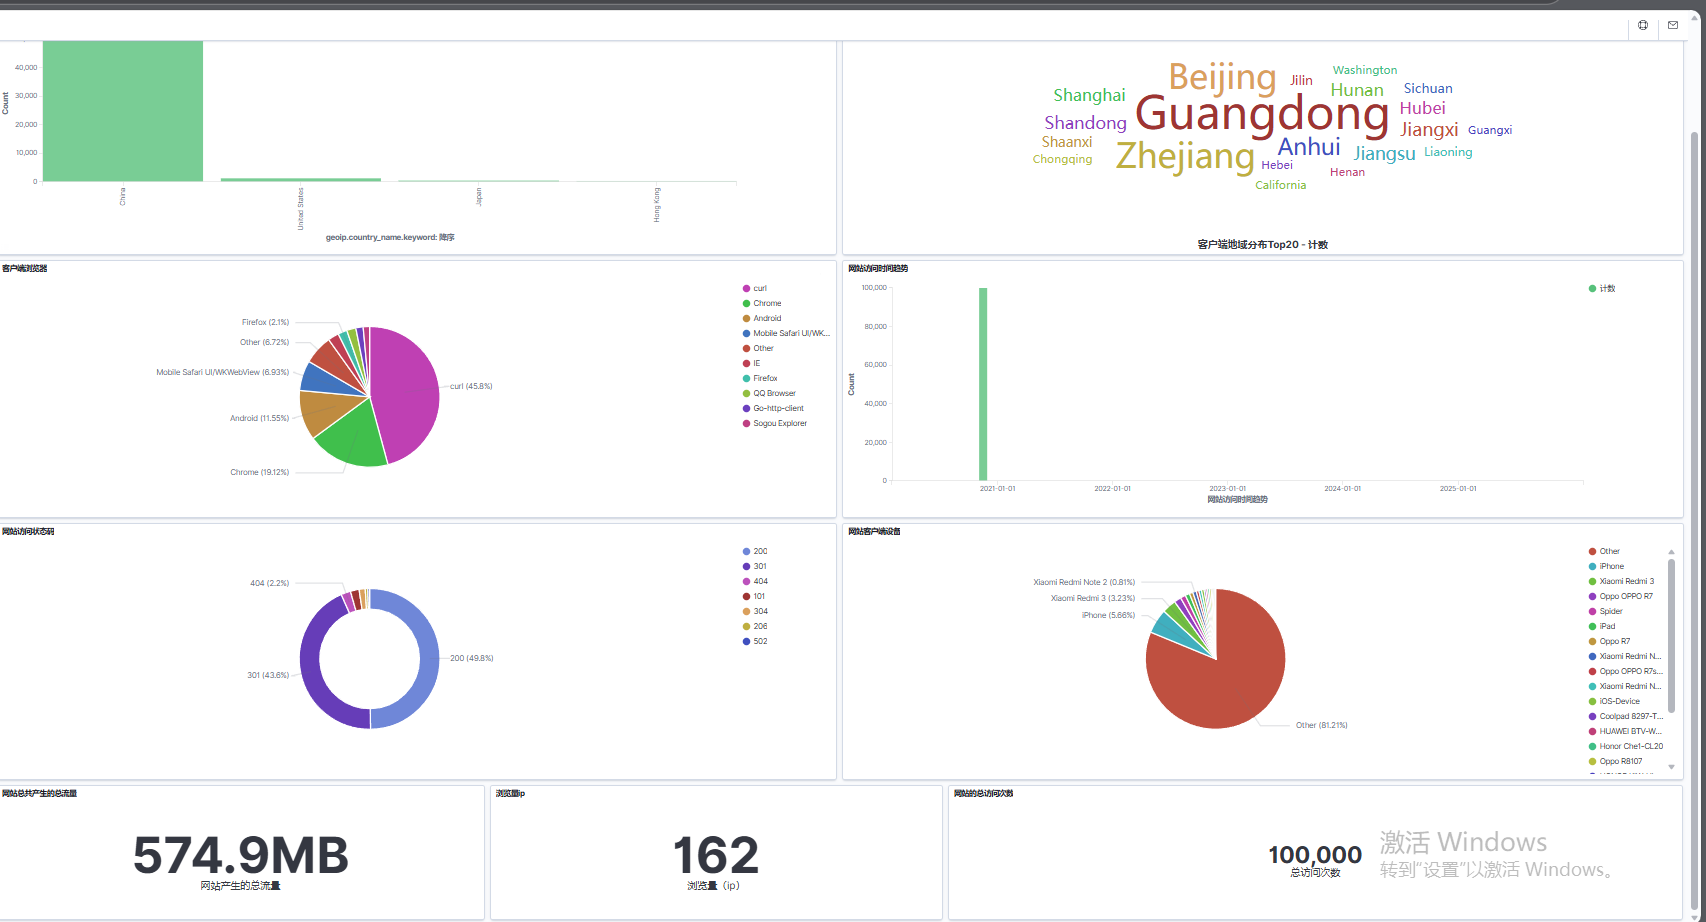
3.Kibana中添加ES索引,读取索引数据并分析展示;
1.查看日志的格式
[root@elk-56 log]# wc -l /var/log/log/nginx_access.log
100000 /var/log/log/nginx_access.log

[root@elk-56 log]# tail -f nginx_access.log
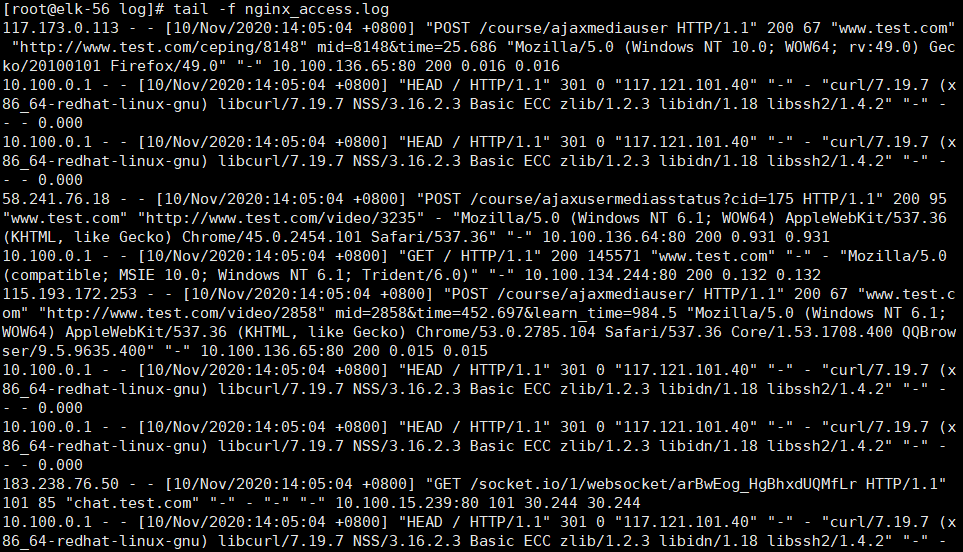
2.创建filebeat文件
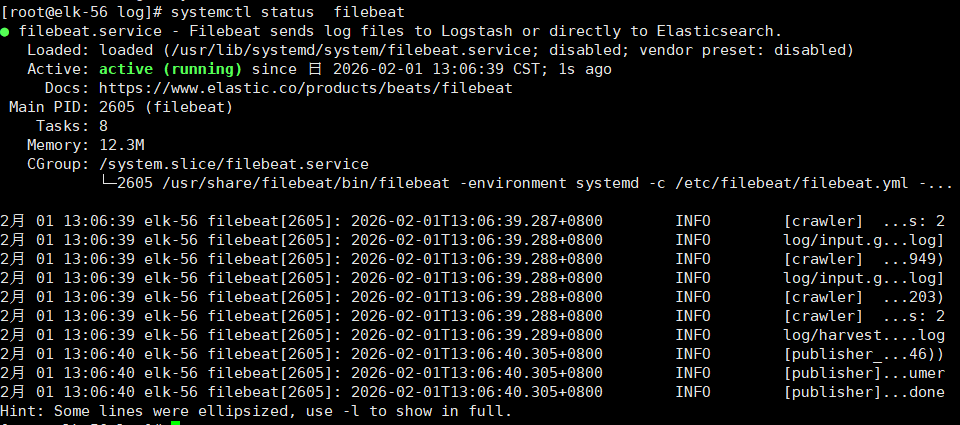
我这里的filebeat是systemctl启动的
也可以使用./filebeat -c /etc/filebeat/filebeat.yml
[root@elk-56 log]# cat  /etc/filebeat/filebeat.yml
t.inputs:
- type: log
  enabled: true
  paths: /var/log/log/nginx_access.log
  tags: ["access"]

- type: log
  enabled: true
  paths: /var/log/nginx/error.log
  tags: ["error"]

#将日志输出给logstash的5044端口
output.logstash:
  hosts: ["192.168.0.95:5046"]
3.配置Logstash 日志过滤
[root@elk-56 log]# cat /etc/logstash/conf.d/nginx.conf
input {
  beats {
    port => 5046
  }
}

filter {
  #通过if判断日志中标签字段包含access,该标签在filebeat中定义
  if "access" in [tags][0] {

    #通过grok将日志解析为json格式
    grok {
      match => { "message" => "%{IPORHOST:clientip} %{USER:ident} %{USER:auth} \[%{HTTPDATE:timestamp}\] \"%{WORD:method} %{URIPATHPARAM:request} HTTP/%{NUMBER:httpversion}\" %{NUMBER:response} (?:%{NUMBER:bytes}|-) %{QS:hostname} (?:%{QS:referrer}|-) (?:%{NOTSPACE:post_args}|-) %{QS:useragent} (?:%{QS:x_forward_for}|-) (?:%{URIHOST:upstream_host}|-) (?:%{NUMBER:upstream_response_code}|-) (?:%{NUMBER:upstream_response_time}|-) (?:%{NUMBER:response_time}|-)" }
    }

    #通过useragent获取客户端的操作系统、浏览器等
    useragent {
      source => "useragent"
      target => "useragent"
    }

    #通过clientip获取客户端地理位置
    geoip {
      source => "clientip"

      #只提取国家和城市
      fields => ["country_name","region_name"]
    }

    #将日志中的timestamp的值赋给@timestamp
    date {
      match => ["timestamp","dd/MMM/yyyy:HH:mm:ss Z"]
      target => "@timestamp"
      timezone => "Asia/Shanghai"
    }

    #通过convert对日志中的数据类型进行转换
    mutate {

      #bytes字段是发送给客户端的文件内容的大小,转换为整数类型
      convert => ["bytes","integer"]

      #response_time字段是服务端的响应时间,转换为浮点类型
      convert => ["response_time", "float"]

      #upstream_response_time字段是负载均衡服务器响应时间,转换为浮点类型
      convert => ["upstream_response_time", "float"]

      #移除不需要的字段
      remove_field => ["message","agent","tags","ecs","input","@version","log","agent","post_args","httpversion"]

      #添加索引名称
      add_field => { "target_index" => "nginx-access-%{+YYYY.MM.dd}"}
    }

      #提取referrer中具体的域名/^"http/
      if [referrer] =~ /^"http/ {

      #通过grok将该字段解析为json格式,获取客户端的来源地址
      grok {
        match => { "referrer" => '%{URIPROTO}://%{URIHOST:referrer_host}' }
        }
      }
  }

  #定义错误日志,在else结构中判断日志中标签字段包含error,该标签在filebeat中定义
  else if "error" in [tags][0] {
    date {
      match => ["timestamp","dd/MMM/yyyy:HH:mm:ss Z"]
        target => "@timestamp"
        timezone => "Asia/Shanghai"
    }

    mutate {
      add_field => { "target_index" => "nginx-error-%{+YYYY.MM.dd}" }
    }
  }
}

output {
  elasticsearch {
    hosts => ["192.168.1.56:9200","192.168.1.57:9200"]
    index => "%{[target_index]}"
  }
}
- 检查语法是否正确
[root@elk-56 log]# logstash -f /etc/logstash/conf.d/nginx.conf  -t
[INFO ] 2026-02-01 13:19:34.232 [LogStash::Runner] runner - Using config.test_and_exit mode. Config Validation Result: OK. Exiting Logstash
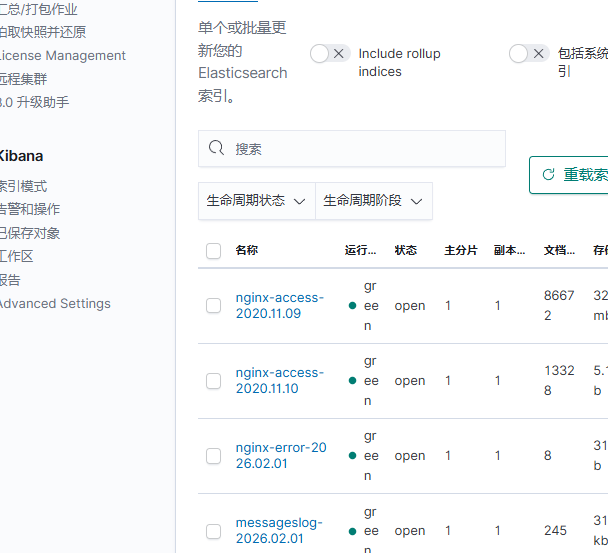
- 在kibana查看数据
4.kibana出图展示

腾讯云面向开发者汇聚海量精品云计算使用和开发经验,营造开放的云计算技术生态圈。
更多推荐
 6
6 0
0- 0


 已为社区贡献5条内容

所有评论(0)