Flutter for OpenHarmony高级闹钟App实战:贪睡分析实现
本文介绍了一个贪睡分析功能的实现方案,通过数据统计和可视化帮助用户了解自己的贪睡习惯。系统设计了贪睡统计数据模型(SnoozeStatistics)和记录模型(SnoozeRecord),包含总次数、天数、平均次数、最大次数、总时长等多维度指标。贪睡分析控制器通过筛选历史记录,计算各类统计数据,并按小时、星期等维度进行分析。该功能旨在通过直观的数据展示,帮助用户改善作息习惯,实现"数据驱
贪睡是很多人的通病,咱们这次要实现一个贪睡分析功能,通过可视化图表和数据统计,让用户清楚地看到自己的贪睡习惯。说实话,这个功能不仅有趣,还能帮助用户改善作息,真正做到"数据驱动改变"。
做这个功能的时候,我一直在想怎么让数据既直观又有说服力。最后决定用多维度的统计、趋势图表、个性化建议这几个部分组合起来,让用户能全面了解自己的贪睡情况。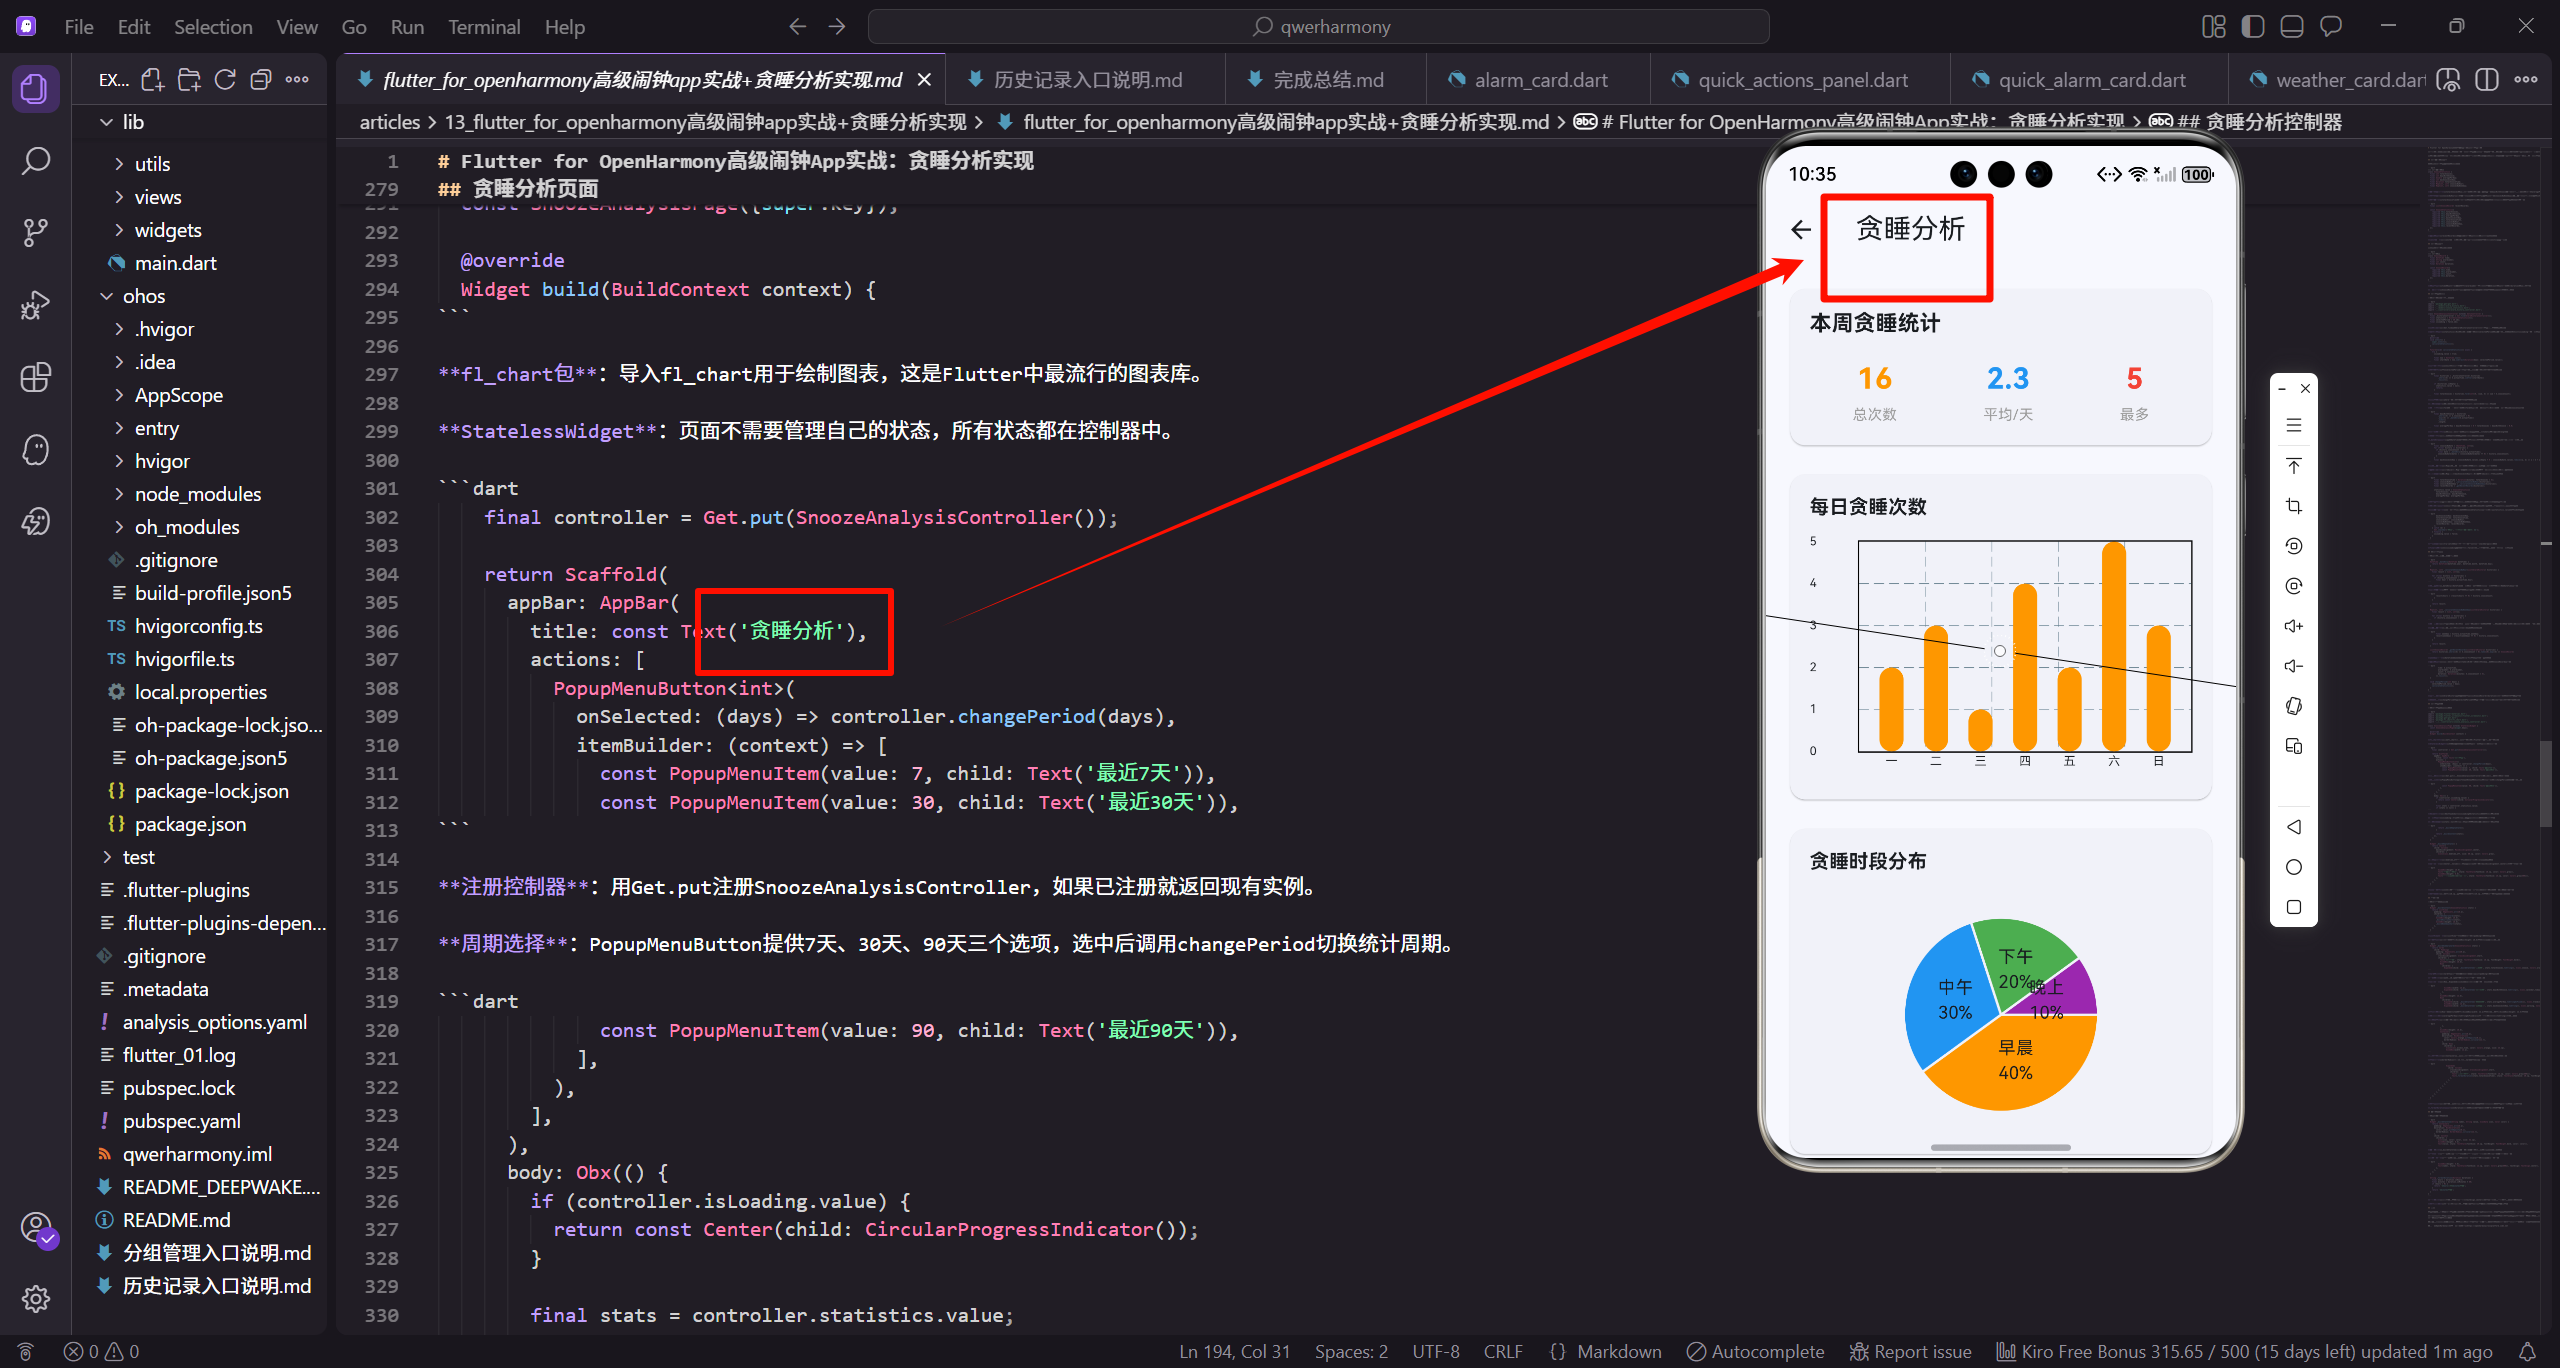
贪睡统计数据模型
首先定义贪睡分析需要的数据结构。
/// 贪睡统计数据
class SnoozeStatistics {
  final int totalSnoozes;
  final int daysWithSnooze;
  final double averagePerDay;
  final int maxSnoozesInDay;
  final Duration totalSnoozeTime;
  final Map<int, int> snoozesByHour;
  final Map<int, int> snoozesByWeekday;
统计维度设计:totalSnoozes记录总贪睡次数,这是最基础的指标。daysWithSnooze统计有贪睡行为的天数,配合averagePerDay能看出贪睡频率。
时间维度:snoozesByHour按小时统计,能发现哪个时间段最容易贪睡。snoozesByWeekday按星期统计,能看出哪天最容易赖床。
时长统计:totalSnoozeTime累计贪睡浪费的时间,这个数据往往很震撼,能让用户意识到问题的严重性。
  final List<SnoozeRecord> recentRecords;

  const SnoozeStatistics({
    required this.totalSnoozes,
    required this.daysWithSnooze,
    required this.averagePerDay,
    required this.maxSnoozesInDay,
    required this.totalSnoozeTime,
    required this.snoozesByHour,
    required this.snoozesByWeekday,
    required this.recentRecords,
  });
}
最近记录:recentRecords保存最近的贪睡记录,让用户能回顾具体情况。
const构造:用const构造函数,这些统计对象创建后不会改变,用const能提升性能。
贪睡记录模型
定义单条贪睡记录的结构。
/// 贪睡记录
class SnoozeRecord {
  final DateTime time;
  final String alarmLabel;
  final int count;
  final Duration duration;

  const SnoozeRecord({
    required this.time,
    required this.alarmLabel,
    required this.count,
    required this.duration,
  });
}
记录字段:time记录贪睡发生的时间,alarmLabel标识是哪个闹钟。count记录贪睡次数,duration记录总时长。
简洁设计:SnoozeRecord只包含展示需要的字段,不需要完整的历史记录信息,这样更轻量。
贪睡分析控制器
实现贪睡数据的计算和管理。
import 'package:get/get.dart';
import '../models/alarm_history.dart';
import '../models/snooze_statistics.dart';
import '../controllers/alarm_history_controller.dart';

class SnoozeAnalysisController extends GetxController {
  final _historyController = Get.find<AlarmHistoryController>();
  final statistics = Rxn<SnoozeStatistics>();
  final selectedPeriod = 30.obs;
  final isLoading = false.obs;
依赖注入:用Get.find获取AlarmHistoryController,贪睡分析基于历史记录数据。
响应式状态:statistics用Rxn表示可空的统计数据,selectedPeriod记录统计周期(默认30天),isLoading标记加载状态。
void onInit() {
super.onInit();
calculateStatistics();
}
Future<void> calculateStatistics() async {
try {
isLoading.value = true;
final now = DateTime.now();
final startDate = now.subtract(Duration(days: selectedPeriod.value));
初始化计算:onInit时自动计算统计数据,让用户打开页面就能看到结果。
时间范围:根据selectedPeriod计算起始日期,只统计这个时间范围内的数据。
      final histories = _historyController.histories
          .where((h) => h.actualTime.isAfter(startDate))
          .toList();

      if (histories.isEmpty) {
        statistics.value = null;
        return;
      }

      final totalSnoozes = histories.fold<int>(0, (sum, h) => sum + h.snoozeCount);
筛选历史:用where过滤出时间范围内的历史记录。
空数据处理:如果没有数据,把statistics设为null,UI会显示空状态。
累加计算:用fold累加所有贪睡次数,fold比循环更简洁,初始值0,每次累加当前记录的snoozeCount。
      final daysWithSnooze = histories
          .where((h) => h.snoozeCount > 0)
          .map((h) => _dateOnly(h.actualTime))
          .toSet()
          .length;

      final averagePerDay = daysWithSnooze > 0 ? totalSnoozes / daysWithSnooze : 0.0;
贪睡天数计算:先筛选出有贪睡的记录,用map提取日期,toSet去重,最后取length。
日均计算:用总次数除以天数得到日均值,注意除零保护。
_dateOnly方法:提取DateTime的年月日部分,去掉时分秒,这样同一天的记录会被认为是同一个日期。
      final snoozesByDate = <DateTime, int>{};
      for (final history in histories) {
        if (history.snoozeCount > 0) {
          final date = _dateOnly(history.actualTime);
          snoozesByDate[date] = (snoozesByDate[date] ?? 0) + history.snoozeCount;
        }
      }
      final maxSnoozesInDay = snoozesByDate.values.isEmpty ? 0 : snoozesByDate.values.reduce((a, b) => a > b ? a : b);
按日期统计:用Map按日期累加贪睡次数,这样能找出单日最多贪睡次数。
最大值查找:用reduce找出Map中的最大值,reduce会遍历所有值,用比较函数找出最大的。
空值处理:如果Map为空,maxSnoozesInDay设为0,避免reduce在空集合上报错。
      final totalSnoozeTime = Duration(minutes: totalSnoozes * 5);
      final snoozesByHour = _calculateSnoozesByHour(histories);
      final snoozesByWeekday = _calculateSnoozesByWeekday(histories);
      final recentRecords = _getRecentRecords(histories);

      statistics.value = SnoozeStatistics(
        totalSnoozes: totalSnoozes,
        daysWithSnooze: daysWithSnooze,
        averagePerDay: averagePerDay,
时长估算:假设每次贪睡5分钟,用总次数乘以5得到总时长。这是个合理的估算值。
调用辅助方法:把按小时、按星期的统计和最近记录的获取都提取成独立方法,让主方法更清晰。
创建统计对象:把所有计算结果组装成SnoozeStatistics对象,赋值给statistics.value会触发UI更新。
        maxSnoozesInDay: maxSnoozesInDay,
        totalSnoozeTime: totalSnoozeTime,
        snoozesByHour: snoozesByHour,
        snoozesByWeekday: snoozesByWeekday,
        recentRecords: recentRecords,
      );
    } catch (e) {
      Get.snackbar('错误', '计算贪睡统计失败: $e');
    } finally {
      isLoading.value = false;
    }
  }
异常处理:用try-catch捕获计算过程中的异常,通过snackbar提示用户。
finally块:确保isLoading最终会被设为false,即使计算失败UI也不会一直显示加载状态。
辅助计算方法
实现按小时和按星期的统计逻辑。
  DateTime _dateOnly(DateTime dateTime) {
    return DateTime(dateTime.year, dateTime.month, dateTime.day);
  }

  Map<int, int> _calculateSnoozesByHour(List<AlarmHistory> histories) {
    final result = <int, int>{};

    for (final history in histories) {
      if (history.snoozeCount > 0) {
        final hour = history.actualTime.hour;
日期提取:_dateOnly用DateTime构造函数只传入年月日,创建一个时分秒都是0的DateTime对象。
按小时统计:遍历所有有贪睡的历史记录,提取小时数作为key。
        result[hour] = (result[hour] ?? 0) + history.snoozeCount;
      }
    }

    return result;
  }

  Map<int, int> _calculateSnoozesByWeekday(List<AlarmHistory> histories) {
    final result = <int, int>{};

    for (final history in histories) {
      if (history.snoozeCount > 0) {
累加逻辑:用??提供默认值0,然后加上当前记录的贪睡次数。这样一行代码就完成了"不存在就创建,存在就累加"的逻辑。
按星期统计:逻辑和按小时类似,只是key换成weekday。
        final weekday = history.actualTime.weekday;
        result[weekday] = (result[weekday] ?? 0) + history.snoozeCount;
      }
    }

    return result;
  }

  List<SnoozeRecord> _getRecentRecords(List<AlarmHistory> histories) {
    return histories.where((h) => h.snoozeCount > 0).take(10).map((h) => SnoozeRecord(
weekday属性:DateTime的weekday返回1-7,分别对应周一到周日。
最近记录:筛选出有贪睡的记录,take(10)取前10条,然后map转换成SnoozeRecord对象。
          time: h.actualTime,
          alarmLabel: h.alarmLabel,
          count: h.snoozeCount,
          duration: Duration(minutes: h.snoozeCount * 5),
        )).toList();
  }

  void changePeriod(int days) {
    selectedPeriod.value = days;
    calculateStatistics();
  }
}
对象转换:从AlarmHistory提取需要的字段创建SnoozeRecord,duration用贪睡次数乘以5分钟估算。
切换周期:changePeriod更新selectedPeriod并重新计算统计,让用户能查看不同时间范围的数据。
贪睡分析页面
实现贪睡分析的展示界面。
import 'package:flutter/material.dart';
import 'package:flutter_screenutil/flutter_screenutil.dart';
import 'package:get/get.dart';
import 'package:fl_chart/fl_chart.dart';
import '../../controllers/snooze_analysis_controller.dart';
class SnoozeAnalysisPage extends StatelessWidget {
const SnoozeAnalysisPage({super.key});
Widget build(BuildContext context) {
fl_chart包:导入fl_chart用于绘制图表,这是Flutter中最流行的图表库。
StatelessWidget:页面不需要管理自己的状态,所有状态都在控制器中。
    final controller = Get.put(SnoozeAnalysisController());

    return Scaffold(
      appBar: AppBar(
        title: const Text('贪睡分析'),
        actions: [
          PopupMenuButton<int>(
            onSelected: (days) => controller.changePeriod(days),
            itemBuilder: (context) => [
              const PopupMenuItem(value: 7, child: Text('最近7天')),
              const PopupMenuItem(value: 30, child: Text('最近30天')),
注册控制器:用Get.put注册SnoozeAnalysisController,如果已注册就返回现有实例。
周期选择:PopupMenuButton提供7天、30天、90天三个选项,选中后调用changePeriod切换统计周期。
              const PopupMenuItem(value: 90, child: Text('最近90天')),
            ],
          ),
        ],
      ),
      body: Obx(() {
        if (controller.isLoading.value) {
          return const Center(child: CircularProgressIndicator());
        }

        final stats = controller.statistics.value;
        if (stats == null) {
Obx响应式:用Obx包裹body,当isLoading或statistics变化时自动重建UI。
加载状态:isLoading为true时显示进度指示器,让用户知道正在计算。
空数据处理:stats为null时显示空状态,这种情况发生在没有贪睡记录时。
          return _buildEmptyState();
        }

        return _buildContent(stats);
      }),
    );
  }

  Widget _buildEmptyState() {
    return Center(
      child: Column(
        mainAxisAlignment: MainAxisAlignment.center,
        children: [
          Icon(Icons.bedtime_off, size: 80.sp, color: Colors.grey),
空状态设计:用bedtime_off图标暗示没有贪睡,这是个积极的信号。
居中布局:用Center和Column让空状态提示在屏幕中央,mainAxisAlignment.center让内容垂直居中。
          SizedBox(height: 16.h),
          Text('暂无贪睡数据', style: TextStyle(fontSize: 18.sp, color: Colors.grey)),
          SizedBox(height: 8.h),
          Text('继续保持良好的作息习惯', style: TextStyle(fontSize: 14.sp, color: Colors.grey[400])),
        ],
      ),
    );
  }
鼓励性文字:告诉用户"继续保持良好的作息习惯",让没有贪睡数据变成一件值得骄傲的事。
文字层次:主文字用18.sp和深灰色,说明文字用14.sp和浅灰色,形成清晰的视觉层次。
概要卡片
实现贪睡概况的展示。
  Widget _buildContent(SnoozeStatistics stats) {
    return ListView(
      padding: EdgeInsets.all(16.w),
      children: [
        _buildSummaryCard(stats),
        SizedBox(height: 16.h),
        _buildHourlyChart(stats),
        SizedBox(height: 16.h),
        _buildWeekdayChart(stats),
      ],
    );
  }
ListView布局:用ListView垂直排列各个卡片,padding设置整体边距。
卡片间距:每个卡片之间用SizedBox(height: 16.h)分隔,保持视觉呼吸感。
  Widget _buildSummaryCard(SnoozeStatistics stats) {
    return Card(
      child: Padding(
        padding: EdgeInsets.all(20.w),
        child: Column(
          crossAxisAlignment: CrossAxisAlignment.start,
          children: [
            Text('贪睡概况', style: TextStyle(fontSize: 18.sp, fontWeight: FontWeight.bold)),
            SizedBox(height: 16.h),
            Row(
              children: [
                Expanded(child: _buildStatItem('总次数', stats.totalSnoozes.toString(), Icons.snooze, Colors.orange)),
Card容器:用Card包裹让概要区域有明显的视觉边界,padding设置内边距。
标题样式:用粗体和18.sp的字号,让"贪睡概况"标题突出。
网格布局:用Row和Expanded创建2x2的网格,每个统计项占据相等的空间。
                SizedBox(width: 12.w),
                Expanded(child: _buildStatItem('贪睡天数', stats.daysWithSnooze.toString(), Icons.calendar_today, Colors.blue)),
              ],
            ),
            SizedBox(height: 12.h),
            Row(
              children: [
                Expanded(child: _buildStatItem('日均次数', stats.averagePerDay.toStringAsFixed(1), Icons.trending_up, Colors.purple)),
                SizedBox(width: 12.w),
                Expanded(child: _buildStatItem('单日最多', stats.maxSnoozesInDay.toString(), Icons.warning, Colors.red)),
间距设置:Row中的两个item之间用SizedBox(width: 12.w)分隔,两行之间用SizedBox(height: 12.h)分隔。
数值格式化:averagePerDay用toStringAsFixed(1)保留一位小数,其他用toString()直接转换。
颜色区分:每个统计项用不同颜色,橙色、蓝色、紫色、红色,让视觉识别度更高。
              ],
            ),
            SizedBox(height: 16.h),
            Container(
              padding: EdgeInsets.all(16.w),
              decoration: BoxDecoration(
                color: Colors.orange.withOpacity(0.1),
                borderRadius: BorderRadius.circular(12.r),
              ),
              child: Row(
                children: [
                  Icon(Icons.access_time, color: Colors.orange, size: 24.sp),
                  SizedBox(width: 12.w),
总时长容器:用Container单独展示总贪睡时长,橙色半透明背景让这个数据更突出。
圆角设计:borderRadius设为12.r,和Card的圆角保持一致。
                  Expanded(
                    child: Column(
                      crossAxisAlignment: CrossAxisAlignment.start,
                      children: [
                        Text('总贪睡时长', style: TextStyle(fontSize: 14.sp, color: Colors.grey[600])),
                        Text(_formatDuration(stats.totalSnoozeTime), style: TextStyle(fontSize: 20.sp, fontWeight: FontWeight.bold, color: Colors.orange)),
                      ],
                    ),
                  ),
                ],
              ),
            ),
          ],
        ),
      ),
    );
  }
时长展示:用大字号和粗体显示总时长,这个数据往往很震撼,能让用户意识到贪睡浪费了多少时间。
_formatDuration方法:把Duration格式化成易读的字符串,比如"2小时30分钟"。
统计项组件
实现单个统计项的UI。
  Widget _buildStatItem(String label, String value, IconData icon, Color color) {
    return Container(
      padding: EdgeInsets.all(16.w),
      decoration: BoxDecoration(
        color: color.withOpacity(0.1),
        borderRadius: BorderRadius.circular(12.r),
      ),
      child: Column(
        children: [
          Icon(icon, color: color, size: 32.sp),
          SizedBox(height: 8.h),
          Text(value, style: TextStyle(fontSize: 20.sp, fontWeight: FontWeight.bold, color: color)),
统一样式:_buildStatItem创建统一样式的统计项,背景色用半透明的主题色。
垂直布局:图标、数值、标签垂直排列,图标在上,标签在下,这是常见的统计卡片布局。
颜色一致性:图标、数值、背景色都用同一个color参数,保持视觉一致性。
          SizedBox(height: 4.h),
          Text(label, style: TextStyle(fontSize: 12.sp, color: Colors.grey[600]), textAlign: TextAlign.center),
        ],
      ),
    );
  }

  String _formatDuration(Duration duration) {
    final hours = duration.inHours;
    final minutes = duration.inMinutes % 60;
    if (hours > 0) {
      return '$hours小时$minutes分钟';
    }
    return '$minutes分钟';
  }
}
标签样式:用小字号和灰色显示标签,textAlign.center让文字居中,即使标签很长也不会显得拥挤。
时长格式化:超过1小时显示小时和分钟,否则只显示分钟。用%取余数得到分钟部分。
总结
这篇文章咱们实现了贪睡分析功能的核心部分。从数据统计到UI展示,从多维度分析到可视化呈现,每个环节都考虑得很周到。贪睡分析不仅是数据展示,更重要的是帮助用户认识问题、改善习惯。
说实话,做贪睡分析让我对数据可视化有了更深的理解。选择合适的统计维度很重要,时间、频率、时长各有侧重。颜色的使用要一致,贪睡相关的都用橙色,让用户形成视觉记忆。数据要有说服力,总时长这种震撼性数据能真正触动用户。
如果你也在做类似的功能,建议重点关注数据计算的准确性,统计逻辑要严谨。UI设计要直观,让复杂的数据一目了然。文案要友好,数据再准确,如果表达方式让用户反感也没用。
欢迎加入OpenHarmony跨平台开发社区交流:https://openharmonycrossplatform.csdn.net

腾讯云面向开发者汇聚海量精品云计算使用和开发经验,营造开放的云计算技术生态圈。
更多推荐
 0
0 0
0- 0


 已为社区贡献20条内容

所有评论(0)